Ask A Researcher
January 2024
2024 Brings a NEW Visualization Tool and Data Updates to the North Dakota State Legislative District Profiles.
Ina Cernusca is the project director for North Dakota Compass and a research specialist within the Center for Social Research. In her role, she leads the design and operation of the ND Compass project to ensure access to reliable, accurate and unbiased demographic and socio-economic data to support informed decision making and community engagement in North Dakota. With extensive experience in market and social research, she has participated in many projects that involved quantitative and qualitative research, grant writing, project management, and outreach/extension activities.
North Dakota Compass is launching a NEW interactive dashboard feature with the recently updated 2024 State Legislative District Profiles. The profiles are intended to encourage dialogue among legislators, members of government agencies, community-based organizations, educators, individuals, and businesses about how to best support communities and residents in North Dakota.
What are the State Legislative District Profiles?
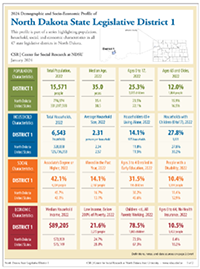
The State Legislative District Profiles present a snapshot of the socio-demographic and economic characteristics of community residents within each North Dakota legislative district. The State Legislative District Profiles have proven useful for legislators to better understand the people they represent, to gain insight through reputable data that would otherwise have been difficult to find, and to understand the strengths and challenges of the district they represent. The profiles have also been helpful for district residents to better understand the neighborhood in which they live, and better inform and educate themselves on the topics considered.
The State Legislative District Profiles compile a number of demographic and socio-economic indicators for the North Dakota State Legislative Districts. The profiles highlight 16 measures focusing on population, household, social, and economic characteristics for each of the districts and subdistricts in North Dakota. The profiles are based on the 2023-2032 North Dakota Legislative District Boundaries approved in November 2021.
The data source for all indicators is the U.S. Census Bureau’s American Community Survey (ACS) 5-Year Estimates. Collecting data over a 5-year period produces a large enough sample for reliable results and is available for small geographies, down to the block group level. The 2024 profiles are using recently updated 2018-2022 estimates.
Where can the State Legislative District Profiles be found?
The individual district profiles are available in PDF format on the North Dakota Compass website, for each year, from 2014 to 2024. Starting with 2019, in addition to the individual profiles, North Dakota Compass created interactive maps to provide an overall view and allow to easily compare district with district.
NEW this year, a more complex interactive dashboard was created that highlights individual profiles and maps and charts for population, household, social, and economic characteristics. In addition, a “Compare” feature allows to users to compare any two of North Dakota’s 47 districts with each other and with North Dakota and the United States.
How can the newly created dashboard be used?
The newly created dashboard makes it easier to visualize the variation in individual and household characteristics among North Dakota’s districts and also to compare individual districts.
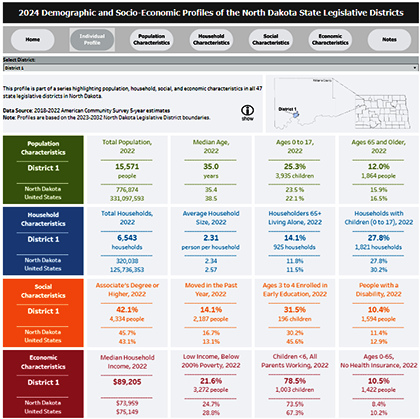
The individual profiles visually mimic the pdf version of the profiles that are available on the website. Simply select the district of your choice to view population, household, social, and economic indicators for that district and compared to North Dakota and the U.S.
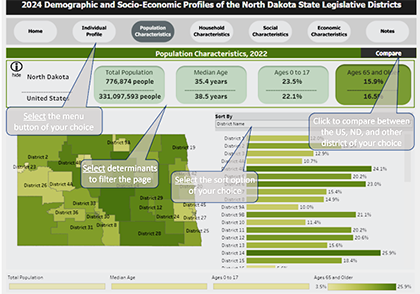
On the ribbon located on the top of the dashboard pages, click on the menu buttons (e.g., population characteristics) to navigate through an overall view of population, household, social and economic characteristics. You can view differences among districts on the map or by sorting the chart on the righthand side by district name or number. All characteristic indicators (e.g., total population, median age) are also compared with North Dakota and U.S. You are also able to access a “how to” screen that helps you navigate each characteristics page, by clicking the “info show” button located on the upper lefthand side of the pages.
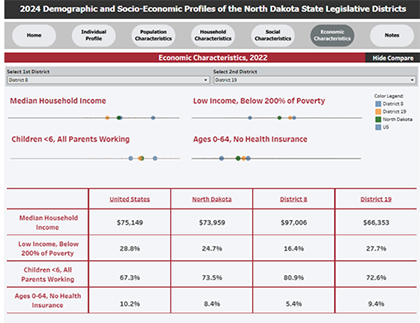
An additional “Compare” feature on the upper righthand side of each characteristics page allows you to compare any two districts of your choice and also compare those districts with North Dakota and the U.S. You can click “Hide Compare”, to return to the original characteristics screen.
Enjoy the latest profiles.
Center for Social Research
North Dakota State University
Compass created by:
Wilder Research
© 2025. All rights reserved.