Data highlight
August 1, 2025
Performance of North Dakota’s two-year community colleges
North Dakota has several two-year post-secondary institutions, commonly known as community colleges. These institutions offer associate's degrees and certificate programs, and many also provide pathways for students to transfer to four-year universities to earn bachelor's degrees.
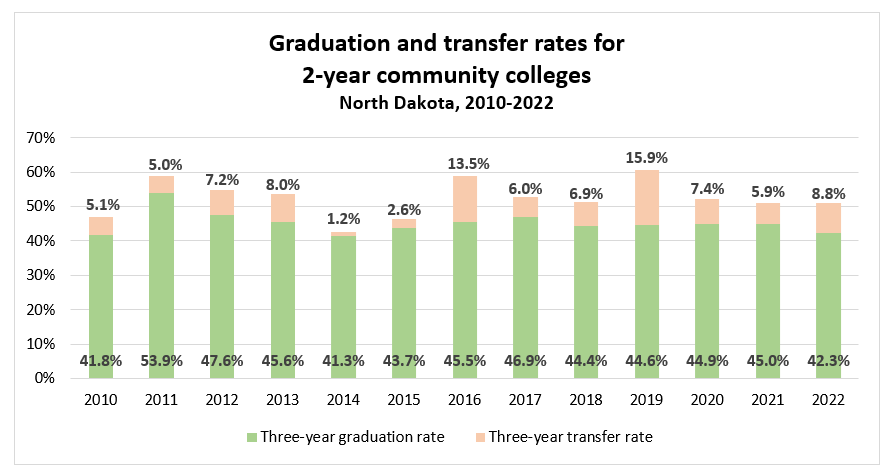
Graduation and transfer rates are key indicators of how effectively colleges support student success and mobility. From 2010 to 2022, North Dakota’s two-year colleges consistently outperformed national averages when graduation and transfer outcomes are combined. During this period, three-year graduation rates remained relatively stable, staying above 40 percent, with a peak of 54 percent in 2011. Transfer rates, however, fluctuated—from a low of 1 percent in 2014 to a high of 16 percent in 2019.
Beginning in 2020, both graduation and transfer rates declined, though transfer rates showed a modest improvement in 2022. North Dakota’s three-year graduation rate was 42 percent in 2022, compared to the national rate of 36 percent. In contrast, the state’s three-year transfer rate was 9 percent, slightly below the U.S. rate of 11 percent in 2022.
These indicators are important since graduating or transferring within three years increases a student’s long-term job prospects and earning potential. Furthermore, local economies depend heavily on community college graduates to fill roles in critical sectors such as healthcare, energy, and the skilled trades.
Note:
The three-year graduation rate reflects the percentage of first-time, full-time, degree-seeking students who complete their program at the same two-year college within 150% of the normal program time (i.e., three years). The three-year transfer rate represents the percentage of first-time, full-time, degree-seeking students who transferred to another institution within 150% of "normal" program time (i.e., within three years).
July 1, 2025
North Dakota Job Growth in 2024 – Steady but Slower.
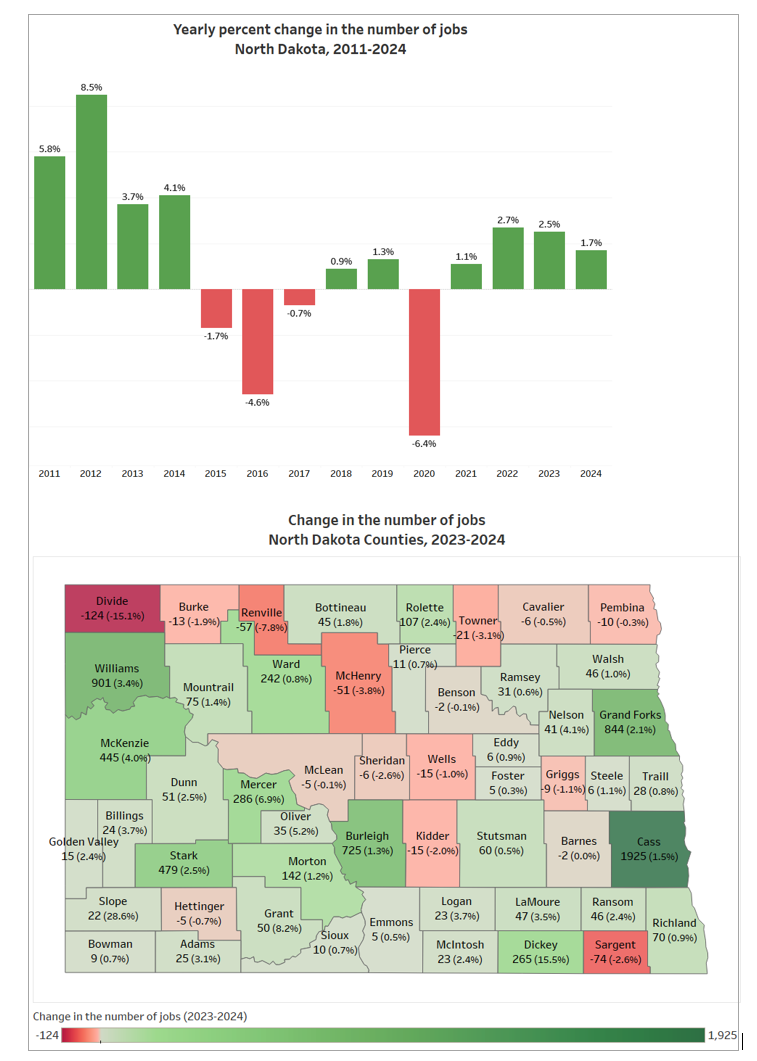
One of the primary sources for tracking employment trends is the Quarterly Census of Employment and Wages (QCEW). This dataset provides a detailed count of jobs based on administrative records from state unemployment insurance programs. While the QCEW captures over 95 percent of employment, it excludes certain groups, including the self-employed, unpaid family workers, military personnel, and most agricultural workers.
Over the past two decades, North Dakota’s employment levels have been significantly shaped by economic fluctuations. The oil boom from 2008 to 2014 drove rapid job growth, particularly in the western part of the state. After peaking in 2014, employment declined from 2015 to 2017 due to a broader economic slowdown, and again in 2020 during the COVID-19 pandemic. Recovery began in 2021 and by 2024 the number of jobs had climbed to 428,692, with a gain of 7,053 jobs (+1.7%) from 2023 to 2024. However, this pace of growth was slightly slower than in the previous two years—an increase of 2.5 percent in 2023 and 2.7 percent in 2022. Despite year-to-year fluctuations, total employment in 2024 remained 20 percent higher than in 2010.
At the county level in 2024, 37 counties reported job gains. Cass County led with an increase of 1,925 jobs, followed by Williams County (+901) and Grand Forks County (+844). Conversely, 16 counties experienced job losses, with Divide County reporting the largest decline (–124 jobs).
Data Source: North Dakota Job Service Labor Market Information, Quarterly Census of Employment and Wages. https://www.ndlmi.com
June 1, 2025
Most major North Dakota cities experienced population growth from 2023 to 2024.
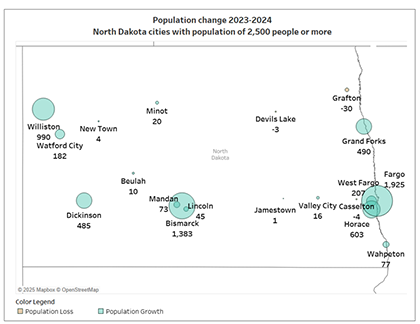
New population estimates for cities and towns, released by the U.S. Census Bureau on May 15, 2025, show that most major cities in North Dakota experienced population growth between 2023 and 2024. These trends highlight ongoing growth in the eastern and central metropolitan areas, as well as a rebound in several western cities.
The Fargo area stands out as a major driver of population growth. The city of Fargo added 1,925 residents from 2023 to 2024 and 10,299 residents from 2020 to 2024. Surrounding urban and suburban cities also contributed to the expansion of the Fargo metropolitan area. West Fargo maintained steady growth, adding 207 people over the past year and 2,126 since 2020. Notably, Horace led all North Dakota cities in percentage growth, increasing its population by 10.6 percent in the past year. Since 2020, Horace’s population has nearly doubled, growing from 3,249 people to 6,286—a 94 percent increase.
Bismarck also saw consistent growth, adding 1,383 residents over the past year and 4,031 residents from 2020 to 2024. Bismarck’s suburban areas grew as well. Lincoln added 45 residents from 2023 to 2024 and Mandan added 73.
Grand Forks experienced more modest but positive growth, adding 696 residents between 2020 to 2024, with 490 of those added in the past year. In contrast, the cities of Minot and Jamestown saw very minimal change, while Grafton and Casselton experienced slight population declines over the past year.
In western North Dakota, population trends reflect a stabilization and recent rebound after earlier declines. While Williston and Watford City showed robust growth from 2023 to 2024, their populations are still slightly below their 2020 levels, suggesting the recent year's growth is a recovery after fluctuation or decline in the past years. Williston, for example, lost 497 residents from 2020 to 2024 but gained 1,869 from 2022 to 2024. Dickinson followed a similar pattern with a slight overall loss of 116 people from 2020 to 2024, while experiencing growth after 2022. Watford City also followed this trend of slight decline post-2020, followed by a more recent recovery.
Data Source: U.S. Census Bureau, Population and Housing Unit Estimates Program, Vintage 2024
May 1, 2025
Single-Parent Families Struggle to Meet Basic Needs in North Dakota.
The median household income represents the midpoint of all household incomes—meaning half of households earn more, and half earn less than this value. The Median Household Income serves as a key indicator of a community’s economic well-being and standard of living. Unlike average income, the median is not skewed by extremely high or low values, making it a more reliable measure of typical household conditions. When adjusted for inflation, changes in median income over time can help us assess whether the economic situation for households is improving or declining. However, changes in median income are not merely the result of the state of the economy, it also reflects changes in household characteristics, such as the size and composition of households, the employment status, and the educational attainment levels of household members, among others.
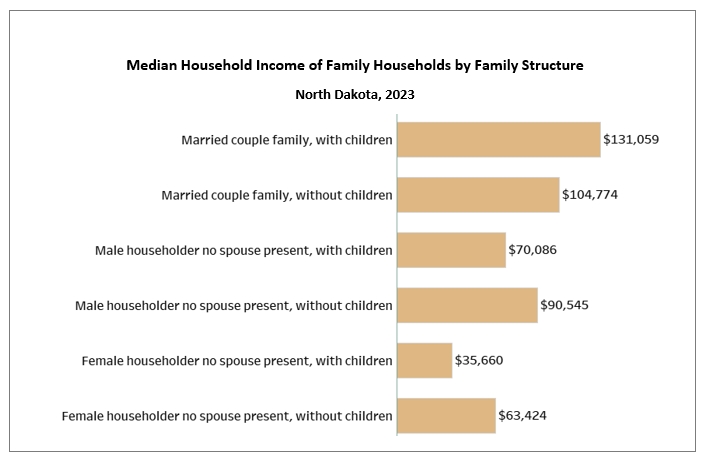
In North Dakota, the median household income in 2023 was $76,525, a slight increase from $74,921 in 2022. However, income levels vary significantly by household structure. In 2023, married-couple families had a median household income of $115,330, compared to $45,661 for non-family households. For family households, family structure also influences income: married-couple families with children had a median income of $131,059 and married-couple families without children had a median household income of $104,774. In contrast, single-father families earned $70,086, and single-mother families had the lowest median income at $35,660.
Notably, many single-parent households earn less than what is required to meet basic living needs. According to MIT’s Living Wage Calculator, a single parent with one child in North Dakota would need an annual income before taxes of approximately $73,152 annually to cover essentials such as housing, food, child care, healthcare, and transportation. This means that the typical income for single-mother families—and even for many single-father families—falls short of the estimated living wage. As a result, a significant share of single-parent families in North Dakota may be unable to meet their basic needs.
Notes: The household income includes the income before taxes of the householder and all other individuals 15 years old and over in the household, whether they are related to the householder or not.
A non-family household consists of a householder living alone (a one-person household) or where the householder shares the home only with people to whom he/she is not related (e.g., a roomate).
Data Source: U.S. Census Bureau, American Community Survey (ACS), 1-year estimates
April 1, 2025
The number of counties that saw population growth slightly surpass those that experienced a decline in 2023-2024 in North Dakota.
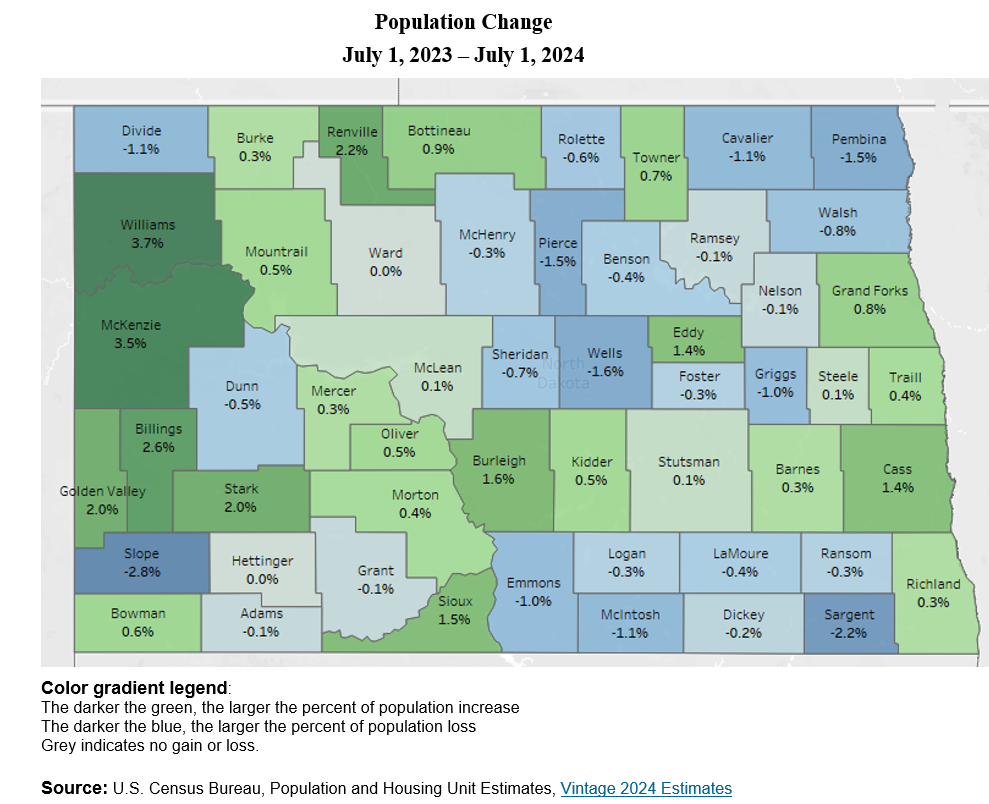
Understanding dynamics in population change can help inform future planning and resource allocation across North Dakota’s counties. From July 1, 2023, to July 1, 2024, North Dakota's population grew by 7,521 people overall. While the state as a whole experienced population growth, change in population varied significantly by county.
According to the latest county population estimates released by the Census Bureau on March 13, 2025, Cass County saw the largest population increase in the state, adding 2,788 residents during this period. Following Cass County, Burleigh County experienced the second-highest population growth, with an increase of 1,623 people, and Williams County added 1,459 people. In total, 28 counties saw population gains, while 25 counties experienced losses. Pembina, Sargent, and Walsh counties saw the largest declines, with Pembina County experiencing the most significant loss, with a decrease of 102 people.
In terms of percentage growth, Williams County led North Dakota with a 3.7% increase in population from 2023 to 2024. McKenzie County followed closely with a 3.5% growth. On the other hand, Slope County experienced the largest percentage loss, with a decrease of 2.8%, followed by Sargent County, which saw a 2.2% decline.
Reasons for population growth or decline varied by county. Generally, counties with the largest population gains attribute that population increase to a positive natural change (more births than deaths), and positive domestic migration (more people moving in from other U.S. counties than leaving the county for other parts of the U.S.). However, Cass County saw a loss of 551 people due to domestic migration but gained 2,190 people through international migration, thus maintaining a positive net migration. Counties with the largest population loss were more likely to have a negative natural change (more deaths than births) and also to experience domestic migration losses. However, Pembina and Walsh counties gained a small number of residents through international migration (24 and 28, respectively), partially offsetting the losses from natural change and domestic migration.
March 1, 2025
North Dakota’s projected population growth not consistent across age groups and geographies.
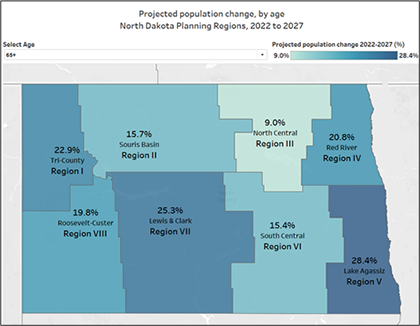
Age-based population projections provide essential insights for long-term planning across various sectors. A young population might indicate future growth but may also require investments in education and childcare. An older population may signal a shrinking workforce and a focus on healthcare services, senior housing, and programs that support aging in place.
According to the 2024 North Dakota Statewide Housing Needs Assessment recently conducted by NDSU’s Center for Social Research in partnership with and on behalf of the North Dakota Housing Finance Agency, North Dakota's population is projected to grow by 27,777 people over five years, from 776,874 in 2022 to 804,651 in 2027 (a 4% growth rate). However, this growth is not expected to be consistent across age groups or geographies.
The most significant population change by 2027 will be the continued aging of the baby-boom generation (those born from 1946 through 1964). Statewide, the population of individuals age 65 and older is projected to increase by 22 percent rising from 123,220 in 2022 to 150,309 in 2027. Every region in the state is expected to see growth in this age group, with increases ranging from 9 percent in Region III to 28 percent in Region V.
Conversely, the 45 to 64 age group is projected to decrease by 3 percent (4,415 people) statewide by 2027, mainly due to the aging forward of baby boomers who are moving into older age categories. While modest growth is expected in Regions I, V, and II (with increases of 5%, 4%, and 2%, respectively), the remaining five of the eight planning regions are expected to experience losses in this age group, with the largest decreases in Regions III and VI, both projected to lose 13 percent.
The population of children and youth in the 0 to 24 age group in North Dakota is projected to remain relatively steady, with a slight decrease of just 0.1 percent from 2022 to 2027. However, in the western part of the state, growth is expected as Region I is projected to grow by 5 percent and Region VIII by 6 percent. Region V is also expected to see modest growth of 2 percent in this age group. In contrast, other areas of the state are expected to experience little change (Regions III, VI, and VII) or a decrease (Regions IV and II, 6% and 3%, respectively).
For the 25 to 44 age group, North Dakota’s population is forecasted to grow by 3 percent by 2027. The eastern part of the state, particularly Regions V and IV, is expected to see the largest increases (9% and 5%, respectively). However, Region II is projected to experience the largest decrease in this age group, with a loss of 8 percent.
Data source: 2024 North Dakota Statewide Housing Needs Assessment - NDSU Center for Social Research Report No. 113 (February 2025)
To select age groups, click here to open an interactive dashboard.
February 1, 2025
Racial and Ethnic Diversity in North Dakota Nearly Doubled Since 2010.
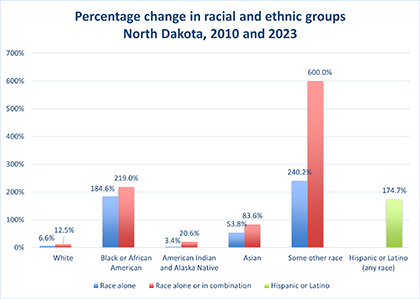
North Dakota has experienced significant growth in racial and ethnic diversity over the past 10-15 years, which was influenced by a combination of economic, demographic, and social factors. One key driver was energy development in the western part of the state, which attracted young workers and their families, many from diverse racial and ethnic backgrounds seeking employment in the energy and construction industries. As a result, North Dakota’s population identifying as a race other than non-Hispanic white almost doubled from 74,600 in 2010 to 145,314 in 2023 - a 95 percent increase. However, this growth varied significantly among different racial and ethnic groups.
Please interpret the following differences in racial and ethnic composition with caution as they may be impacted by changes implemented by the Census Bureau in question design, processing, and coding, to better capture how people choose to self-identify.
- The white population, the largest group in North Dakota with 647,059 people identifying as white alone (83% of total population) and 697,402 as white alone or in combination with another race (89% of total population) in 2023, increased at the lowest rate as compared with other racial and ethnic groups. The white alone population increased by 7 percent since 2010, while the white alone and in combination category grew by 13 percent during the same time period.
- North Dakota's American Indian population remained the largest non-white racial group, representing 4 percent of the state’s population in 2023. Growth in this group has been modest, with the American Indian or Alaska Native alone population increasing by 3 percent since 2010. However, individuals identifying as American Indian alone and in combination with another race grew by 21 percent, from 42,100 in 2010 to 50,766 in 2023.
- The number of North Dakotans who identify as Black or African American alone nearly tripled (185% increase) from 8,601 people in 2010 to 24,479 people in 2023. Those identifying as Black or African American alone and in combination with other races saw an even greater increase of 219 percent.
- The Asian population in North Dakota also grew, though at a lower rate compared to other groups. People identifying as Asian alone increased by 54 percent, from 10,266 in 2010 to 18,834 in 2023. Those identifying as Asian alone and in combination with other races grew by 84 percent.
- People reporting a single race other than one of the five race categories provided on the Census form (i.e., white, Black or African American; Asian; American Indian or Alaska Native; and Native Hawaiian or Other Pacific Islander) were classified under Some other race. The number of these people in North Dakota more than tripled (240% increase) from 2010 to 2023. Additionally, individuals identifying as some other race in combination with another Census designated racial group (e.g., white or Black) increased sevenfold, reflecting a 600% increase.
- The Hispanic or Latino population of any race has grown significantly in North Dakota, increasing by 175 percent from 13,919 in 2010 to 38,229 in 2023.
Despite these notable changes, North Dakota remains one of the least racially and ethnically diverse states in the U.S. Furthermore, diversity is unevenly distributed across the state, with urban areas having higher concentrations of immigrant and minority populations due to job opportunities and community services. Additionally, diversity is more pronounced among younger generations, with the younger population being significantly more diverse than older age groups.
Data Source: U.S. Census Bureau, American Community Survey, 1-year estimates
Note:
Race alone: The Race alone category includes only individuals who selected a single race category (e.g., only Asian). If someone selected both Asian and one or more other races, they won’t be included in the Asian alone, but in the Asian in combination with another race category.
Race alone or in combination: This category includes everyone who identified with a particular race, whether they selected it alone or in combination with another race. The "alone or in combination" category gives a broader picture of how many people have some connection to that racial group, regardless of whether they identify with additional racial backgrounds.
January 1, 2025
North Dakota ranks first among Midwest states in population growth rate from 2023 to 2024.
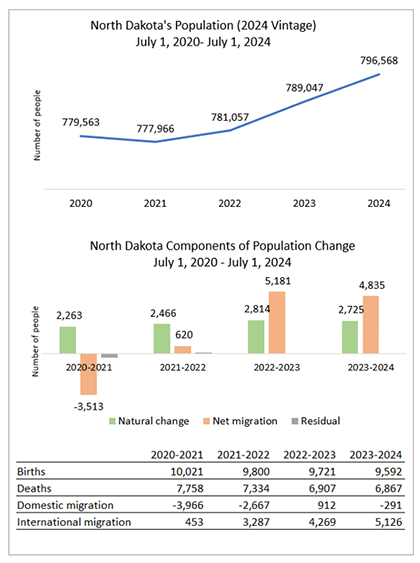
After a slight population decline during the COVID-19 pandemic in 2020-2021, North Dakota's population is back on a continued growth trend. As of July 1, 2024, the state reached 796,568 residents, according to the U.S. Census Bureau’s Population and Housing Estimates released in December 2024. This marks a growth of 7,521 people (1%) from the revised 2023 estimate of 789,047. Notably, this one percent increase ranks North Dakota first among the other states in the Midwest and 16th among all U.S. states in population growth rate.
Examining the components of change reveals important trends in North Dakota’s population dynamics. While both annual births and deaths have declined since 2020-2021, the overall natural change has improved, as deaths decreased at a higher rate than births (11% compared to 4%, respectively). Between July 1, 2023, and July 1, 2024, there were 9,592 births and 6,867 deaths, resulting in a natural increase of 2,725 people. Notably, North Dakota is one of 32 states where births exceeded deaths during this period.
Net migration also played a significant role in population change. Between July 2023 and July 2024, the state recorded a positive net migration of 4,835 people, though slightly below the revised 2022-2023 figure of 5,181. This positive trend is largely driven by international migration, which added 5,126 residents, offsetting a domestic migration loss of 291 in 2023-2024.
Maintaining a positive natural increase and the ability to attract and retain residents contributes to North Dakota’s continued population increase.
Note: Annual releases of population and housing unit estimates involve revisions to yearly estimates going back to the most recent decennial census and are based on updated administrative records, geographic boundaries, and methodology. In addition to that, for the Vintage 2024 population estimates, administrative data were used to adjust the net international migration estimates. Details on this adjustment are available in the Random Samplings blog, Census Bureau Improves Methodology to Better Capture Increase in Net International Migration.
Source: U.S. Census Bureau, Population and Housing Unit Estimates Vintage 2024 Estimates
Data Highlight Archive
Center for Social Research
North Dakota State University
Compass created by:
Wilder Research
© 2025. All rights reserved.