Ask A Researcher
April 2025
North Dakota Compass Releases the 2025 Compass Points.
ND Compass, by the NDSU Center for Social Research, is a centralized source for curated, reliable, and unbiased actionable demographic and socio-economic data, placed in context, to support decision-making and community engagement in North Dakota. Data and information are available on a wide range of topics and at various levels of geography. More than just a data and information website, ND Compass also connects with a wider audience by providing less formal, reader-friendly content to increase public knowledge on key issues through articles, newsletters, and social media posts.
Compass Points 2025, ND Compass’ signature publication sponsored by Dakota Medical Foundation, just launched, and continues to capture the current state of North Dakota, how North Dakota fares in relation to other states, and measures of progress over time in key topic areas. The goal of this publication is to provide data and analysis to better identify and build understanding about the issues and opportunities facing the state of North Dakota.
Below are several of the notable trends highlighted in this year’s edition of Compass Points.
North Dakota ranks first among Midwest states in population growth rate for 2023-2024.
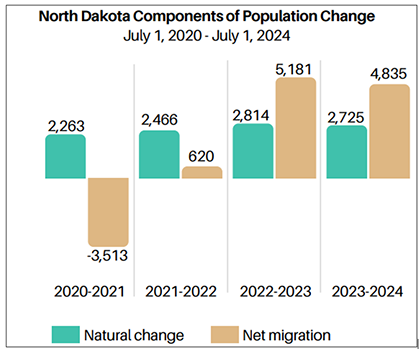
As of July 1, 2024, North Dakota’s population reached 796,568 people, according to the U.S. Census Bureau’s Population and Housing Estimates Program. This marks an increase of 7,521 people (1%) from the revised 2023 estimate of 789,047. Notably, this one percent growth rate ranks North Dakota first among Midwest states and 16th among all U.S. states.
This growth is attributed to positive natural change (births exceeding deaths by 2,725 people) and a net migration of 4,835 people. The positive net migration was largely driven by international migration, which added 5,126 residents, offsetting a domestic migration loss of 291 in 2023-2024.
Data source: U.S. Census Bureau, Population and Housing Unit Estimates Vintage 2024 Estimates
Poverty rate decreased in North Dakota from 2022 to 2023 but varied by demographic group.
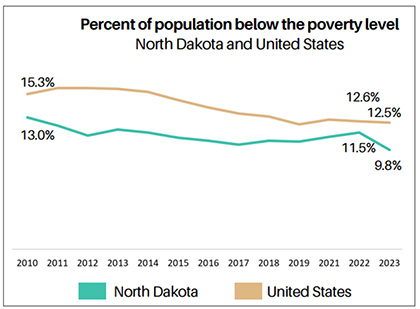
In North Dakota, 10% of the population lived below the poverty line in 2023, a notable decrease from 12% in 2022 and lower than the national average of 13% in 2023. Among North Dakota children younger than 18 years, the poverty rate also dropped, from 13% in 2022 to 9% in 2023.
However, not all demographic groups in North Dakota experienced the same trend. From 2022 to 2023, poverty rates declined for all age groups except adults age 65 and older, whose rate slightly increased. Women continued to experience higher poverty rates than men (12% compared to 8%), although rates for both genders declined over the same period. Similarly, the foreign-born population had a higher poverty rate than the native-born population (13% versus 10%), though both groups saw improvement from the previous year as well.
In 2023 North Dakota led the nation in annual real GDP growth.
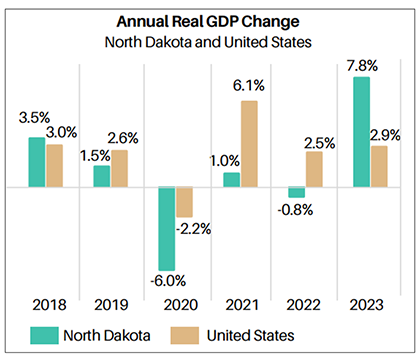
North Dakota's Gross Domestic Product (GDP) varies as a result of fluctuations in commodity prices in the energy and agriculture sectors. After experiencing moderate growth before 2020, the state’s economy was significantly impacted by the pandemic, leading to a substantial GDP decline in 2020. However, by 2023, North Dakota had the highest annual GDP growth of any state (7.8%), more than double the national average of 2.9%.
At the local level, North Dakota's GDP varies regionally. Energy producing regions of the state typically have higher GDP per capita. Urban counties such as Cass, Burleigh, and Grand Forks have more diverse economies and also generally report higher and more stable GDP levels. Rural counties typically have lower per capita GDP.
Fewer Working-Age Adults per Older Adult: A Growing Challenge for North Dakota.
Shifts in the population's age structure have significant implications for society. Nationwide, declining birth rates, combined with increased life expectancy and the aging of the baby boomer generation, have led to a shrinking working-age population (ages 18 to 64) relative to the older adult population (ages 65 and older).
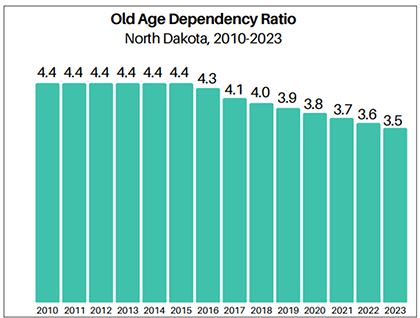
In North Dakota, this trend is also evident. There were approximately 4.4 working-age individuals for every older adult in 2010. By 2020, this ratio dropped to 3.8, and by 2023, it declined further to just 3.5 working-age individuals per older adult.
Despite having one of the youngest median ages in the nation (36.0 in 2023), North Dakota’s working-age-to-older-adult ratio is expected to continue decreasing. This trend presents growing challenges for workforce availability, retirement systems, health care services, and elder care.
More than 3 in 4 North Dakota adult males are overweight or obese.
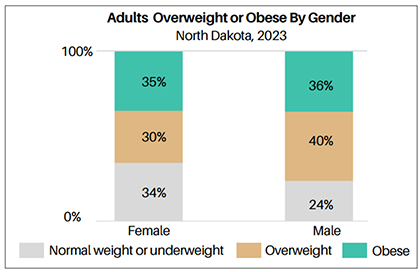
Data from the 2023 Behavioral Risk Factor Surveillance Survey (BRFSS) reveals that 36% of North Dakota adults are overweight, while another 36% are classified as obese.
Males are more likely than females to be overweight or obese. In 2023, 40% of males were overweight and 36% were obese, compared to 30% of females being overweight and 35% being obese. While the percentage of overweight adults has changed little over time, obesity rates have risen. Among adult males, obesity rate increased from 30% in 2011 to 36% in 2023. Similarly, the obesity rate among adult females grew from 25% to 35% over the same period.
Disparities in High School Graduation Rates Persist in North Dakota.
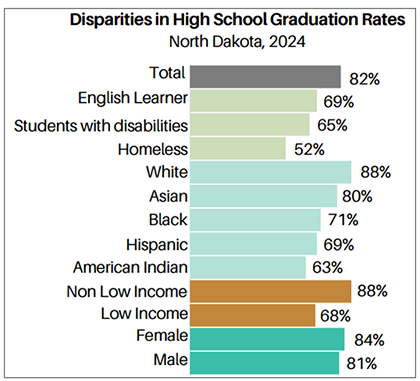
North Dakota's on-time high school graduation rates remained fairly steady until 2020. However, after reaching 89% in 2020, the rate consistently declined to 82% in 2024.
Significant disparities in high school graduation rates among student groups continue into 2024. White students have the highest graduation rate at 88%, while rates are lower among other racial and ethnic groups. Economically disadvantaged students (low income) face a substantial gap, graduating at a rate 20 percentage points lower than their higher-income peers. Female students graduate at slightly higher rates than male students. Special populations—including English learners and students with disabilities—also experience lower graduation rates. The greatest challenge is faced by homeless students, with only 52% graduating on time.
State of the State
The state of the state segment of Compass Points provides key metrics in all topics on the ND Compass website, highlighting how North Dakota compares (ranking) to other states and how the state is trending.
North Dakota ranked among the top 5 states for…
- The percentage of adults (age 16-64) who are working (80.5% - first place, highest percentage)
- Annual change in real GDP (7.8% - first place, highest percentage)
- The percentage of children (under age 6) with all parents working (75.9% - first place, highest percentage)
- The percentage of households who are cost-burdened from housing (23.0% - 2nd lowest percentage)
- Percentage of residents (under age 65) who are uninsured (5.3% - 5th lowest percentage)
North Dakota ranked among the bottommost states for…
- The percentage of children (3 and 4 years old) enrolled in preschool (26.8% - rank 50th out of 50 states, lowest percentage)
Compared to the previous year, North Dakota improved on ...
- Annual change in real GDP (increased from a loss of 0.8% in 2022 to a gain of 7.8% in 2023)
- Total nonfarm payroll jobs (increased from 428,100 in 2022 to 437,400 in 2023)
- The percentage of 8th graders who are proficient in math (increased from 34.6% in 2023 to 37.0% in 2024)
- The percentage of residents (under 65 years) who are uninsured (decreased from 7.5% in 2022 to 5.3% in 2023)
Compared to the previous year, North Dakota trended unfavorably on ...
- Homeownership rate (decreased from 65.1% in 2022 to 63.7% in 2023)
Data for the 2025 Compass Points is provided by North Dakota Compass with the most recent data updated in February 2025, unless defined otherwise. Data sources, years, margins of error, and additional notes are available on ndcompass.org.
Download the 2025 Compass Points.
Browse ndcompass.org for more data and trends.
