Ask A Researcher

October 2021

Vaccine acceptance and hesitancy in North Dakota.

Ina Cernusca is the project director for North Dakota Compass and a research specialist within the Center for Social Research. With extensive experience in market and social research, Ina has participated in many projects that involved quantitative and qualitative research, grant writing, and outreach/extension activities. Born and raised in Romania, Ina moved to the United States in 2001 with her family. Ina earned her MBA from the University of Missouri, in Columbia, MO, and worked as a marketing research specialist with the Center for Agroforestry at the University of Missouri prior to moving to North Dakota.

In this article, Ina introduces a new study on vaccine acceptance and hesitancy in North Dakota and launches the invitation to explore the associated dashboard.


Data is critical to understand the impact of COVID-19 across North Dakota and inform the appropriate response to the wide range of challenges created by the pandemic. To help North Dakota organizations and communities with new and reliable data resources, the Center for Social Research at North Dakota State University continued to analyze U.S. Census Bureau Household Pulse Survey microdata to examine various impacts of the pandemic on North Dakota households.

After examining the impacts of the pandemic on households with children and households that lost employment income since the beginning of the pandemic, this most recent study looked into vaccine acceptance and hesitancy in North Dakota.

According to North Dakota Department of Health, as of September 2021, 56 percent of the North Dakota adult population has received at least one dose of COVID-19 vaccine. Following authorization for emergency use of COVID-19 vaccines in December 2020, the number of people receiving a COVID-19 vaccine increased at a high rate from January to end of March. However, despite increased availability of vaccines for various age groups, the vaccination rate was much lower in April and the following months.

The SAGE Working Group on Vaccine Hesitancy (the World Health Organization’s advisory group of experts on immunization) defines vaccine hesitancy as a delay in acceptance or refusal of vaccines despite availability of vaccine services. The hesitancy behavior is influenced by a number of factors: confidence (trust), complacency (do not perceive a need for a vaccine) and convenience (access).

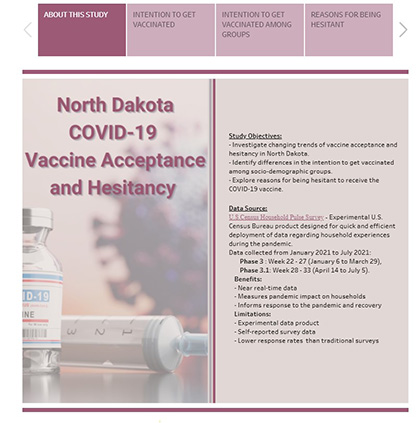
To shed some light on the specifics of COVID-19 vaccine acceptance and hesitancy in North Dakota, the present study had the following objectives:

  • Investigate changing trends of vaccine acceptance and hesitancy in North Dakota.
  • Identify differences in the intention to get vaccinated among socio-demographic groups.
  • Explore reasons for being hesitant to receive the COVID-19 vaccine.

The study used data collected from January 2021 to July 2021 by the U.S. Census Household Pulse Survey, an experimental U.S. Census Bureau product designed for quick and efficient deployment of data regarding household experiences during the pandemic. Data analyzed was collected in two phases:

  • Phase 3: Week 22 - 27 (January 6 to March 29),
  • Phase 3.1: Week 28 - 33 (April 14 to July 5).

The new study examined the following questions:

Do people in North Dakota intend to receive a COVID-19 vaccine once available to them?

The intention to get a COVID-19 vaccine was captured by a survey question introduced in week 22 of Phase 3 of the U.S. Census Bureau's Household Pulse Survey. The question was asked of those who declared that they have notreceived a vaccine yet.: Once a vaccine to prevent COVID-19 is available to you, would you…

  • Definitely get a vaccine;
  • Probably get a vaccine;
  • Unsure about getting a vaccine (introduced staring with week 28 - Phase 3.1);
  • Probably not get a vaccine;
  • Definitely not get a vaccine. undecided

Among those who have not received a vaccine at the time they answered the survey, the percentage of those whose intention was to definitely get a vaccine, decreased from beginning of January (week 22) to beginning of July (week 33), as COVID-19 vaccines became increasingly available and more people were getting vaccinated. This is reflective of the rapid and early response to available vaccines by those not vaccine hesitant. Conversely, the percentage of those whose intention was to definitely not get a vaccine, increased during the same time period. While the actual number of individuals that indicated they will definitely not get a vaccine stayed roughly the same over time, the number of unvaccinated people (the base to calculate the percent of those who accept or are hesitant to take a COVID-19 vaccine) decreased from 485,569 people in week 22 to 165,746 in week 33, resulting in an increase in the percentage of unvaccinated individuals that indicated that they will definitely not get a vaccine. Due to a change in survey instrument in week 28, the percentage of those who would probably get a vaccine, unsure, or probably not get a vaccine are not comparable between the two phases.

Get more details on trends

Does the intention to get a COVID-19 vaccine differ among socio-demographic groups?

Overall, from January to July 2021, the intention to get vaccinated against COVID-19 differed among some socio-demographic groups.

  • The intention to definitely get a vaccine was highest within their respective socio-demographic groups for people age 65 and older and those with a bachelor’s degree or higher.
  • The intention to definitely not get a vaccine was highest within their groups for people with less than a bachelor’s degree, and people not covered by any type of health insurance.
  • The intention to probably not get a vaccine was highest within their groups for people identified as White and people covered by some type of health insurance.

We strongly recommend that caution is used when comparing intention to get a vaccine within and across groups and to check margins of error (by hovering over each bar in the chart) when looking at results on the dashboard. In some cases, despite what may appear to be differences between different categories, there is not enough evidence to conclude that those differences are not due to chance alone.

Explore all groups

What are the reasons for being hesitant to take a COVID-19 vaccine? Did the reasons change with increase vaccine availability?

By excluding those who declared they would definitely get a vaccine, all others are by definition considered hesitant (i.e., those who answered probably get a vaccine, unsure about getting a vaccine, probably not get a vaccine, definitely not get a vaccine).

The main reasons mentioned by individuals who declared they will probably not take a vaccine and those who will probably take a vaccine, were safety (i.e., I plan to wait and see if it's safe and I am concerned about possible side effects) and concern for other people (i.e., I think other people need it more). Concern about side effects increased in phase 3.1 for both, those probably not taking and probably taking the vaccine. Concern that other people may need it more decreased in phase 3.1 since everyone who wanted to get a vaccine was able to get it.

The main reasons mentioned by those who declared they will definitely not get a vaccine were trust and concern for side effects (i.e., I don't trust COVID-19 vaccines, I don't trust government, and I am concerned about possible side effects,). There were no significant differences between the beginning of the year (phase 3) and mid-year (phase 3.1) since everyone who wanted to get a vaccine was able to get it.

The Unsure response was only added to the survey in phase 3.1. Main reasons for being unsure are the same as for probably take or probably not take a vaccine (i.e., I plan to wait and see if it's safe and I am concerned about possible side effects).

Delve into the reasons and compare by phase.

About the data source
The U.S. Census Bureau’s Household Pulse Survey measures the impact of COVID-19 on households across the U.S. from a social and economic perspective. This survey was designed to be as comprehensive as possible, administered quickly, and provide data in near real-time. While the data have some limitations due to online administration and lower response rates, benefits are notable since the survey produces near real-time data to help measure the impact of the COVID-19 pandemic on households. Data collection for the Household Pulse Survey began on April 23, 2020 and is conducted in phases. The questions about vaccines were introduced mid-Phase 3 in week 22 and updated in Phase 3.1 (starting with week 28). The survey is currently collecting data in Phase 3.2. Survey data are released through an interactive data tool, tables, and microdata. The Household Pulse Survey Interactive Tool provides a visual representation of all the measures for the U.S., each of the 50 states and D.C., and for the 15 largest metropolitan statistical areas. Data tables in Excel for each week of release are available for download. In addition, microdata files are available to create custom tabulations and allow users to delve further into the rich data collected in the Household Pulse Survey.

Explore the dashboard!


Ask a researcher archive

Dean Bangsund and Nancy Hodur. Sugarbeet Industry in the Northern Plains: Economic Contribution in Minnesota and North Dakota.
April 2024

North Dakota Compass. North Dakota Compass Releases the 2024 Compass Points
March 2024

Nicholas Bauroth. City Governance: Commission or Council for Fargo, North Dakota?
February 2024

Ina Cernusca. 2024 Brings a NEW Visualization Tool and Data Updates to the North Dakota State Legislative District Profiles.
January 2024

Samuel Faraday Saidu and Chelsey Hukriede. Strapped for Safety: Exploring Insights into Car Seat Knowledge Among North Dakota Mothers.
December 2023

Debarati Kole and Kendra Erickson-Dockter. A Comprehensive Look at the Multifaceted Risk Factors of Postpartum Depression
October 2023

Valquiria F. Quirino and Avram Slone. COVID-19 pandemic in North Dakota: Significance, progression, and government response.
September 2023

Karen Olson. The Lasting Impact of Maternal Childhood Trauma
August 2023

Avram Slone. The Social Variability of COVID-19 Mortality in North Dakota between March 11th, 2020 and February 13th, 2022
July 2023

Nancy Hodur and Dean Bangsund. Agriculture a Key Driver in the North Dakota economy
June 2023

Karen Olson. Health and Well-Being in North Dakota. Understanding how the five social determinants of health are impacting the ability of North Dakotans to thrive
May 2023

Kendra Erickson-Dockter. North Dakota Compass: 10 years of Measuring Progress and Inspiring Action.
April 2023

Hannah Hanson & Grace Njau. Every Dad Counts: North Dakota Fatherhood Experiences Survey
March 2023

Nancy Hodur. Housing Market Conditions and Declining Homeownership Rates
February 2023

North Dakota Compass. 2022 Recap: Data highlighted throughout the year
January 2023

Kendra Erickson-Dockter. A Look into a Chronic Condition and Pregnancy: Preexisting Diabetes PRAMS Points 2022
December 2022

Nancy Hodur and Karen Olson. Lower-income households and baby boomers, main drivers for North Dakota housing needs in the near term
November 2022

Avram Slone. The Impact of COVID-19 on Group Quarters in North Dakota
October 2022

Chelsey Hukriede. Safe Sleep PRAMS Points 
September 2022

Kendra Erickson-Dockter. Gestational Diabetes PRAMS Points – A NEW Dashboard Format!
August 2022

Aastha Bhandari, Debarati Kole, Dr. Nancy Hodur. Mission Of Mercy: Giving hope through a smile.
July 2022

Ina Cernusca.Households with children have been disproportionately affected by the COVID-19 pandemic, especially in the first year of the pandemic.
May 2022

Andy Wiese and Karen Olson. One Health System’s Approach to Improving Community Health. Understanding what the 2021 Community Health Needs Assessment Conducted by Sanford Health means for population health
April 2022

Mariel Lopez-Valentin and Grace Njau. North Dakota Title X, Family Planning Needs Assessment
January 2022

Nancy Hodur and Dean Bangsund. North Dakota Lignite Energy Industry Workforce
December 2021

Ina Cernusca. Vaccine Acceptance and Hesitancy in North Dakota
October 2021

Nancy Hodur and Karen Olson. Rural Communities Will Benefit from a New Cooperative in Walsh County
September 2021

Matt Schmidt and Grace Njau. COVID-19 Trends Among North Dakota Children, March 2020 – March 2021
August 2021

Kendra Erickson-Dockter and Ina Cernusca. COVID Hardship on North Dakota Households: New study on the impacts on North Dakota households that lost employment income during the pandemic
July 2021

Chelsey Hukriede and Kendra Erickson-Dockter. NEW! PRAMS Points – A Brief Infographic using North Dakota PRAMS Survey Data
May 2021

North Dakota Compass: A look inside the 2021 Compass Points
April 2021

Ina Cernusca: Households with children are disproportionately affected by the COVID-19 pandemic
March 2021

Ina Cernusca: Differences in COVID-19 Risk Factors at District Level
February 2021

Kendra Erickson-Dockter, Chelsey Hukriede, and Grace Njau: An Introduction to the North Dakota Study of Associated Risks of Stillbirth (SOARS)
October 2020

Karen Ehrens: North Dakota Families are Facing Food and Other Hardships in the Wake of COVID-19 Pandemic, and Helpers Respond
September 2020

Ina Cernusca: Taking the pulse of North Dakota households during the COVID-19 pandemic.
July 2020

Nancy Hodur:Challenges of Grocery Stores in Rural North Dakota
May 2020

North Dakota Compass:2020 Compass Points: Measuring progress. Inspiring action.
March 2020

Amy Tichy:Student Veterans in the College Classroom.
February 2020

North Dakota Compass:North Dakota Compass launches the 2020 State Legislative District Profiles
January 2020

Grace Njau, Nancy Hodur:&Chelsey Hukriede: Risk Behaviors among Women with a Recent Live Birth in North Dakota: Findings from the 2017 North Dakota Pregnancy Risk Assessment Monitoring System (PRAMS)
November 2019

Ina Cernusca:& Karen Olson: Behind the scenes – The story of the North Dakota State Legislative District Profiles
October 2019

Ina Cernusca: Key demographic trends in North Dakota.
August 2019

Karen Olson: The 30th edition of the Annie E. Casey Foundation’s KIDS COUNT® Data Book finds that 175,772 children will shape the future of a more diverse North Dakota.
July 2019

Shweta Arpit Srivastava & Dr. Ann Burnett: “Giving rope and pulling it back”: Parental dilemmas to prevent adolescent substance use
June 2019

Ina Cernusca: 2019 Compass Points: Setting direction for improving the quality of life in North Dakota
May 2019

Joshua Marineau and Onnolee Nordstrom: Learning from Fargo -- An Exploration of the Fargo-Moorhead Entrepreneurial Ecosystem
March 2019

Nancy Hodur: Improving Oral Health for Older Adults in North Dakota
November 2018

Rachelle Vettern: Engaging Volunteers across Generations
October 2018

Karen Olson: The 2018 KIDS COUNT® Data Book reveals strengths and challenges for children in North Dakota – and emphasizes that an inaccurate census in 2020 threatens to worsen existing challenges for North Dakota youth
July 2018

Lori Capouch: Is food access a concern in rural North Dakota?
May 2018

Deb Nelson: Williston Basin 2016: Employment, Population, and Housing Forecasts – An Overview
January 2018

Karen Olson: North Dakota among Top 10 States in Country for Child Well-Being
July 2017

Nancy Hodur: SEAL!North Dakota: A School Dental Sealant Program
June 2017

Grace Njau: A Brief Introduction to the North Dakota Pregnancy Risk Assessment Monitoring System (PRAMS)
April 2017

Ina Cernusca: North Dakota’s Women study: A brief overview
March 2017

Dean Bangsund: Effects of Fargo-Moorhead Area Diversion on Spring Planting for Producers
February 2017

Deb Nelson: Vision West: Leading, Educating, and Collaborating to Mobilize the 19 Western North Dakota Counties Towards Resilience and Prosperity
December 2016

Nancy Hodur: North Dakota Statewide Housing Needs Assessment: A Brief Overview of the Population and Housing Forecast component
November 2016

Social Isolation: Experiential Narratives of African Refugee Women in the Fargo-Moorhead Community
September 2016

Sean Brotherson: Father Involvement and the Future of Children and Families
July 2016

Carol Cwiak: Bakken Oil: What Have We Learned and What Will We Do Differently Next Time
June 2016

Jessica Creuzer: The Changing Face of Western North Dakota: What are the Effects of Increased Travel from Energy Development
April 2016

ND Compass: City Profiles
February 2016

ND Department of Health: Making Change Happen
January 2016

Jennifer Weber: A Bold New Direction for the North Dakota University System - The NDUS Edge Dashboards
December 2015

Wendy Troop-Gordon: What Has Science Taught Us About Bullying?
November 2015

ND Compass: A Look at the Youngest North Dakotans
October 2015

Kendra Erickson-Dockter: Growing Older in North Dakota
September 2015

Michael Ziesch: Data You Can Trust: The Labor Market Information Center
August 2015

Malini Srivastava and Troy Raisanen: efargo: City Scale Sustainability
July 2015

Kevin Iverson: The State Repository of Census Information- The North Dakota Census
June 2015

Wonwoo Byun: Reducing Sedentary Behavior is a Key for Obesity Prevention in Children
May 2015

Kathryn Gordon: The Science of Suicide Prevention
April 2015

ND Compass: Tell a Story with Data! The Importance of Crade-to-Career Success
March 2015

Abby Gold: Community Food Systems: Food Charters and More
February 2015

Heather Fuller-Iglesias: The Importance of Recognizing the Role of Social Support in Human Development Across the Lifespan
January 2015

Michael Carbone: Using Data to End Homelessness
December 2014

Randal Coon: Tribal Colleges Contribute to the State's Economy
November 2014

Deb White: Women's Representation in Elected Office
October 2014

Randal Coon: Pull Factors Measure Retail Trade Performance
September 2014

Karen Olson: North Dakota ranks Well Nationally with Regard to Overall Child Well-Being; However, Substantial Opportunities for Improvement Exist
August 2014

Julie Garden-Robinson: Guard Against Grilling Gaffes: Healthy Grilling and Food Safety Tips
July 2014

Michael Noone: Extreme Weather Patterns- North Dakota Has It All
June 2014

Kathleen Tweeten: Why All Community Development Decisions Should Use the Community Capitals Framework
May 2014

Clayton Hilmert: Stress effects on pregnancy: The impact of the 2009 Red River flood on birth weight
April 2014

Karen Ehrens: Food Deserts and how they impact North Dakota
March 2014

Gretchen Dobervich and Kendra Erickson-Dockter: New Geographic Profiles: How they can work for you
February 2014

Compass Staff: "New Compass Team Brings Changes in 2014"
January 2014

Donna Grandbois: "Fargo-Moorhead American Indian Community-Sponsored Health Needs Assessment"
November 2013

Karen Olson: "North Dakota KIDS COUNT - why it counts for you
October 2013

Nancy Hodur: "Western North Dakota School Administrators Face Challenges"
August 2013

Megan Chmielewski: "Annual population estimates tell interesting stories about North Dakota's growth patterns"
July 2013

Ramona Danielson: "Learn how to make the ND Compass website work for you"
May 2013

Karen Olson: "About the American Community Survey (ACS)"
February 2013

North Dakota Compass

Center for Social Research
North Dakota State University

Compass created by:
Wilder Research

© 2024. All rights reserved.