ASk A Researcher
May 2013
Learn how to make the ND Compass website work for you
Ramona Danielson, North Dakota Compass
 Compass Assistant Director Ramona Danielson provides an orientation to key aspects of the site, including what are social indicators, who will find this site useful, and how to use some of the more in-depth areas of the site.
Q: What are social indicators?
A: Social indicators represent important dimensions reflecting quality of life in our state. They allow us to examine how we are doing by providing points of comparison along with different aspects that help us understand the topic better, such as differences by geography or by characteristics such as age, gender, or race. We are also able to look at changes over time. The ND Compass website seeks to provide uniform social indicators that are comparable across different geographies to learn where we are today, inspire action to improve quality of life, and measure progress over time.
For example, one social indicator on the site is median income, a key measure found under the Economy topic. Although North Dakota historically lagged behind the national average in median income (by 18 percent in 1999), in 2011 the median income in North Dakota surpassed the national average. It is helpful to provide some context to these impressive gains, as there are notable differences by region and by type of household. Due to energy development activity in the western part of the state, median incomes in Region I (Divide, McKenzie, and Williams counties) have increased by 53 percent since 1999 (using 2011 dollars). In contrast, median incomes in Region III (Benson, Cavalier, Eddy, Ramsey, Rolette, and Towner counties) have remained about the same while median incomes in Region IV (Grand Forks, Nelson, Pembina, and Walsh counties) have declined since 1999. Among single parents, the median income for single fathers in 2011 was double that of single mothers. Married couples with children had median incomes four times higher than single mothers.
Q: Who will find this site useful?
A: ND Compass is for community leaders, researchers, politicians, non-profit organizers, and anyone else who would like to learn more about key measures that describe the quality of life in their communities and across North Dakota. We use the term community in a broad context because the relatively small size of the vast majority of places in North Dakota restricts the availability of data due to confidentiality issues and lack of data collection at that level. The larger geographic area data are useful for tasks like strategic planning, grant-writing, and forwarding discussions about what constitutes well-being among our citizens and in our communities. The graphics help illustrate complicated data and are excellent for visual learners. They are easily downloadable to include in presentations. The For Discussion and Ask a Researcher columns provide in-depth analysis and input on important topics from key stakeholders and experts across the state.
Q: When does the information get updated?
A: The data on the ND Compass website get updated shortly after it is released by the primary source. Most indicators are updated annually. Many of our indicators come from the American Community Survey, which releases new data throughout the year since it is a continue data collection process. Some of the jobs data are updated monthly, generally lagging behind by only a few months. We work closely with Wilder Research to make sure the most up-to-date data are available on ND Compass.
Q: How do I find data on the site?
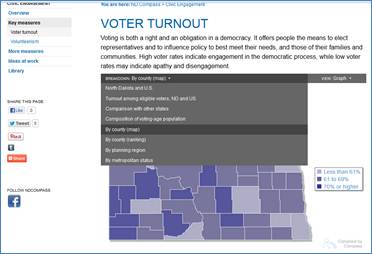
A: The black navigation bar across the top of the page lists the various topic areas available on the site. Each topic area includes an Overview, which provides context and key trends explaining why it’s important to the well-being of your community. On the left-hand side of each topic page, a list of key measures is provided. Within a key measure, data are presented in graph form. At the top of each graph, there are two dropdown menus. The first dropdown menu is the “Breakdown” menu which provides a list of available detailed breakdowns of the key measure by geography and characteristic.

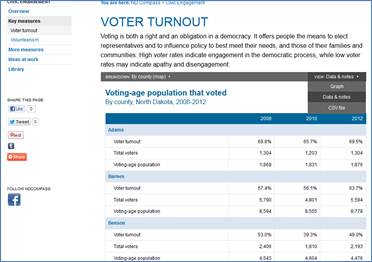
The second dropdown menu is labeled “View” and defaults to the Graph view. The “Data and notes” view option provides more detailed information, including trend data when available, numerators and denominators, data sources, definitions, and important qualifications. The “View” menu also includes the option to download the data as a CSV file, which is easily imported into a spreadsheet-type program for further manipulation.

Q: Where do I go to find information for my area?
ND Compass measures progress for the state, its eight planning regions, 53 counties, four Native American reservations, and larger cities (see map). Different geographies are available under the “Breakdown” menu above the graph in each key measure, as described above. In addition, we are currently working with our partners at Wilder Research to develop profiles for each of these geographies. The profiles will offer most of the data available for each geography in one convenient table. These should be available by summer.
Q: What is the difference between “Key Measures” and “More Measures”?
A: Each topic has up to four key measures which have been selected using a combination of criteria including that the data must be: relevant, valid, timely, leading, policy-responsive, and affordable to collect. We modeled our site after the award-winning MN Compass site developed by Wilder Research, and have technical working groups composed of content experts from across North Dakota to provide assistance in helping make sure the key measures best meet selection criteria. However, for each topic area, there may be a great deal of additional useful information to foster deeper understanding of the issue. The More Measures section includes links to a variety of data-rich sites that enable the reader to dig deeper and take a more thorough look at the topics.
Q: How should I use the “Ideas at Work” and “Library” sections?
A: One of our goals with ND Compass is to connect people across the state to each other and to share information and ideas that can help make our communities the best they can be. We believe that leveraging and encouraging interdependence and collaboration are among the keys to fostering success. In the “Ideas at Work” section, you will find links to projects, organizations, and collaborations focused on particular issues relevant to the social indicators on ND Compass. In the “Library” section, you will find stand-alone reports and publications that offer opportunities to dig even deeper into issues, as well as interpretation and exploration of evidence-based strategies and solutions.
Q: What can I expect from ND Compass in the future?
A: In addition to the regularly updated data for the existing key measures on the site, we continue to engage our key stakeholders to make sure that the data and resources on the site reflect the trends and values of our state. In addition to the geography-specific profiles described above, we will be adding a community building resource section. We will also be adding some additional key measures within existing topic areas (such as Civic Engagement and Environment) as well as additional topic areas (such as Disparities, Public Safety, and Transportation). We look forward to opportunities to share ND Compass with the state, and will be exploring options such as webinars and presentations. Our newsletter, which launched in April 2012, will be published monthly and highlight the ongoing For Discussion and Ask a Researcher columns as well as other key happenings. We also look forward to expanding our mission for promoting the use of social indicators in North Dakota through efforts like an annual report card and an annual conference. While we have relied on the generous support of foundations to launch this project, we are looking to create sustainability by expanding the financial support of the website through partnerships with public and private entities interested in maximizing their impact by collectively supporting the vision of our initiative: to Measure Progress and Inspire Action.
