Ask A Researcher
February 2021
Differences in COVID-19 Risk Factors at District Level.
![]()
Ina Cernusca is the project director for North Dakota Compass and a research specialist within the Center for Social Research. With extensive experience in market and social research, she has participated in many projects that involved quantitative and qualitative research, grant writing, project management, and outreach/extension activities. Born and raised in Romania, Ina moved to the United States in 2001 with her family. Ina earned her MBA from the University of Missouri, in Columbia, MO, and worked as a marketing research specialist with the Center for Agroforestry at the University of Missouri prior to moving to North Dakota.
In this article, Ina draws attention to the large variation in individual and household characteristics among North Dakota’s districts, that suggest a differential approach in trying to mitigate the impact of the pandemic on North Dakota’s communities.
North Dakota Compass launched the 2021 State Legislative District Profiles. The profiles are intended to encourage dialogue among legislators, members of government agencies, community-based organizations, educators, individuals, and businesses about how to best support communities and residents in North Dakota. The State Legislative District Profiles present a snapshot of the socio-demographic and economic characteristics of community residents within each North Dakota legislative district. A detailed boundary map for each of the 47 state legislative districts can be found on the North Dakota Legislative Branch website. The State Legislative District Profiles have proven useful for legislators to better understand the people they represent, to gain insight through reputable data that would otherwise have been difficult to find, and to understand the strengths and challenges of the district they represent. The profiles have also been helpful for district residents to better understand the neighborhood in which they live, and better inform and educate themselves on the topics considered.
The individual district profiles are available in PDF format on the North Dakota Compass website, for each year, from 2014 to 2021. Starting with 2019, in addition to the individual profiles, North Dakota Compass created interactive maps that provide an overall view and allow to easily compare district with district. The data source for all indicators is the U.S. Census Bureau’s American Community Survey (ACS) 5-Year Estimates. Collecting data over a 5-year period produces a large enough sample for reliable results and is available for small geographies, down to the block group level. The 2021 profiles are using recently updated 2015-2019 estimates.
In the light of the COVID-19 pandemic, the indicators included in the legislative profiles take on additional meaning by providing information about the risk factors to the pandemic and reveal the potential disproportionate impact that the pandemic may have on North Dakota’s communities. The North Dakota State Legislative Profiles and the interactive maps, in particular, show a large variation in individual and household characteristics among North Dakota’s districts that suggest a differential approach in trying to mitigate the impact of the pandemic on North Dakota’s communities. While these are pre-pandemic data, they help to better understand the risk of specific population groups and communities and provide information about how individuals and households within a community may recover from the health, social, and economic impacts of the pandemic.
Here are some of the indicators that are provided on the Legislative District Profiles and their implications for the pandemic and recovery efforts:
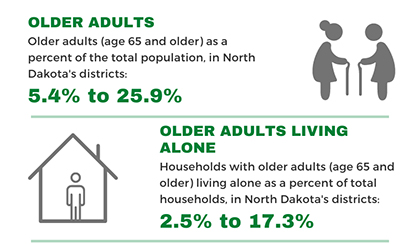
Older adults (age 65 and older)
The number and percentage of older adults in total population have become increasingly important to track, as the baby boom generation, which began turning 65 in 2011, is expected to grow significantly over the next 10 years. Recently, the COVID pandemic has brought even more attention to this age group. Since the beginning of the pandemic, the Centers for Disease Control and Prevention (CDC) recognized older adults as an important risk group due to their weaker immune system and the increased likelihood of having multiple chronic diseases. The real-life experience of the pandemic revealed additional implications for the older adult population. In addition of suffering more severe complications and higher mortality than other age groups, they also experienced social isolation and loneliness which can result in depression, anxiety, and other health problems. Additionally, older adults living alone may experience significant declines in their financial well-being and difficulty in accessing food, transportation, and health care as a result of the pandemic. Furthermore, the high COVID-19 mortality rate among older adults may lead to an increase of older adults living alone.
In North Dakota, indicators regarding older adults vary greatly among districts:
- The percentage of older adults varies from 5.4 percent (District 16) to 25.9 percent (District 28). North Dakota’s average is 14.9 percent.
- The percentage of households with older adults living alone varies from 2.5 percent (District 40) to 17.3 percent (District 5) . North Dakota’s average is 10.7 percent.
Household income and poverty
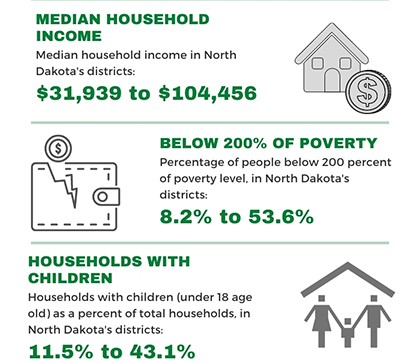
Household income
Median household income represents the central income point of the total number of households, including those with no income, and it is a gauge of the overall economic health of the region and the financial resources of its residents. The health and economic crisis caused by the COVID-19 pandemic resulted in the loss of employment income for many people for a variety of reasons (e.g., illness with coronavirus, caring for ill family members, accommodating the caretaking caused by closed services, employment loss due to furlough or business closures). The loss of employment and employment income in a household can have various implications from not being able to purchase enough food or pay rent, to mental health issues.
- In North Dakota, at the district level, the median household income ranges from $31,939 (District 21) to $104,456 (District 22). North Dakota’s median income is $64,894.
While employment income loss due to the pandemic was widespread, it was disproportionately in households that were in lower income categories and households with children under age 18.
Low income, below 200% of poverty
This indicator reflects the number of people with a household income below 200 percent of the federal poverty level. We chose this indicator for the Legislative District Profiles, as opposed to the number and percentage of people living below 100 percent the poverty level, because research shows that families need an income of approximately twice the official poverty threshold (i.e., 200% of poverty) to cover the entire cost of basic expenses for housing, food, transportation, healthcare, and childcare. The percentage of people living in or near poverty is a measure of the overall economic health of a region. It also indicates the level of need for social and government supports. While the federal financial aid during the pandemic helped with offsetting growing poverty rates for a period, the need is still great, especially in areas where people were already living with low incomes.
- At a legislative district level, the percentage of people with low income (below 200% of poverty) ranges from 8.2 percent (District 22) to 53.6 percent (District 42) in North Dakota. North Dakota’s average is 25.5 percent.
Households with children
The number and percentage of children as well as the percentage of households with children are usually tracked to inform planning for childcare, schools, and businesses, especially as North Dakota has experienced the fastest growing child population in the nation. The COVID-19 pandemic brought more attention to households with children since they were more likely to have experienced negative economic effects than households without children. Households with children were more likely to experience loss of employment income, food insecurity, disruption in education, access to healthcare, and mental health issues, than households without children.
- At a legislative district level, the percentage of households with children (under age 18) ranges from 11.5 percent (District 21) to 43.1 percent (District 9) in North Dakota. North Dakota’s average is 27.7 percent.
Health-related indicators
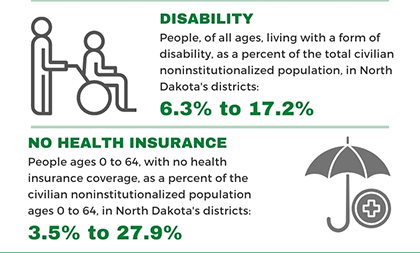
Disability
The disability indicator provides perspective on the number of individuals living with some difficulty in vision, hearing, movement, and/or cognition. This can play an important role in understanding the need for housing options, such as living and aging in place – and spark further discussion regarding policies or building incentives that might allow this to happen. The pandemic brought additional challenges to this vulnerable population, especially to those with limited mobility and people with intellectual and developmental disabilities who suffered educational, occupational, clinical, social and personal effects of the pandemic. From exacerbated feelings of isolation and mental health, to limited access to caregivers, service providers, and therapies, the pandemic took a disproportionate toll on families and individuals with certain disabilities.
- In North Dakota, at the district level, the percentage of people, of all ages, living with some form of disability ranges from 6.3 percent (District 45) to 17.2 percent (District 9). North Dakota’s average is 11.0 percent.
Health insurance
Individuals without health insurance have limited access to healthcare (whether preventive or ongoing) which can lead to a greater risk of illness and hospitalization. In addition, a lack of health insurance for children can have a negative influence on school attendance and participation in extracurricular activities, and increased financial and emotional stress among parents.
The large majority of people younger than age 65 rely on employer sponsored health insurance. Due to the pandemic, many people lost their health insurance, due to losing their jobs.
- At a legislative district level, the percentage of adults (under age 65) without health insurance ranges from 3.5 percent (District 5) to 27.9 percent (District 9) in North Dakota. North Dakota’s average is 8.5 percent.
The large range of these indicators across North Dakota’s districts suggest that communities are at different risk to be affected by the COVID-19 pandemic. As each community responds to the challenges brought on or amplified by the pandemic, understanding the differences in risk factors becomes critically important as these communities will need to craft tailored responses across a wide range of situations to improve community health and wellbeing.
Resources
Adults in Households With Children More Likely to Report Loss in Employment Income During COVID-19
COVID-19 Disproportionately Impacting Those With Developmental Disabilities
COVID-19 Pandemic’s Impact on Household Employment and Income
Economic Fallout From COVID-19 Continues To Hit Lower-Income Americans the Hardest
Center for Social Research
North Dakota State University
Compass created by:
Wilder Research
© 2025. All rights reserved.