Ask A Researcher
August 2019
Key demographic trends in North Dakota.
.jpg)
Ina Cernusca is a research specialist within the Center for Social Research at NDSU and the project director for ND Compass. North Dakota Compass provides and promotes the use of reliable, accurate, and unbiased demographic, economic, and socio-economic data to support informed decision-making and community engagement in North Dakota. In this article, Ina highlights key demographic trends in North Dakota as revealed by the Census Bureau’s annual population estimates.
nt in the United States (U.S.), the U.S. Census Bureau produces annual estimates of the population which are released in July of each year. The Population Estimates Program uses administrative data on births, deaths, Federal tax returns, Medicare enrollment, and immigration to update the decennial counts and estimate the population of the United States by age, sex, race and ethnicity at national, state, and county levels. These estimates are used in the allocation of funds to state, county, and local governments.
New data recently released by the U.S. Census Bureau’s Population Estimates Program reveals contrasting patterns of demographic changes in North Dakota across the state and compared to general trends in the U.S.
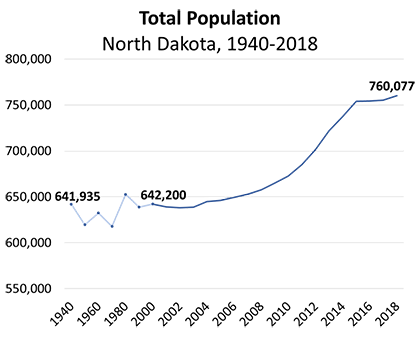
North Dakota’s population overall has changed dramatically during the past 18 years. In the 60 years from 1940 to 2000, the state’s population remained relatively steady, averaging about 635,000 people. From 2000 to 2018 however, the state’s population increased by about 118,000 people (which, for comparison, was the population of Fargo in 2015), reaching 760,077 people. Energy development had a significant impact on population change within the state. Substantial in-migration of young workers and an increase in the number of births has resulted in unprecedented population growth. While the growth rate has currently slowed, North Dakota still experienced the fifth largest percentage growth in population of all states from 2010 to 2018.
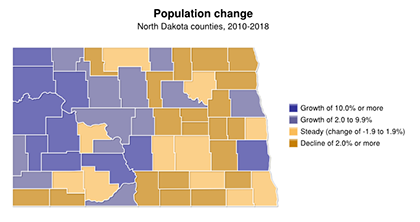
From 2010 to 2018, western North Dakota counties experienced extraordinary growth. McKenzie County more than doubled its population (114% increase) and Williams County grew by half (58% increase). In addition, nine counties, mainly in the western and metropolitan areas grew by at least 10 percent and 12 counties saw modest growth (ranging from 2% to 9.9%). However, in contrast to this growth, population in the remaining 30 counties remained steady or decreased during this time period.
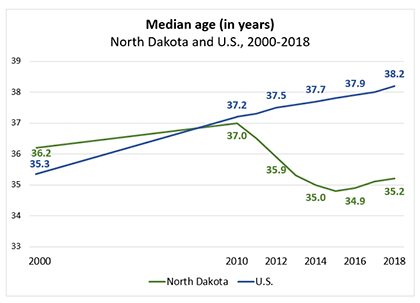
The population in most states has increasingly become older. The increase in the median age (the age where half of the population is younger and the other half older) is largely a result of the aging baby-boom generation (those born from 1946 to 1964) and increased life expectancy. The median age in the U.S. steadily increased from 35.3 years in 2000, to 37.2 in 2010, and to 38.2 in 2018. However, North Dakota was one of the few states that has reversed this trend.
For years, North Dakota’s population had been getting older as younger generations moved out of the state in search of work. North Dakota’s median age in the year 2000 was almost one year older than the nation’s. However, beginning in 2010 things changed. From 2010 to 2015, North Dakota’s population grew younger as the median age continually decreased from 37.0 years in 2010 to 34.8 in 2015. While the median age started to increase in 2016, North Dakota was still the only state in 2018 with a younger median age when compared to 2010 (37.0 years in 2010 to 35.2 years in 2018).
A look at the population change by age groups in North Dakota and the U.S. explains some of the difference in median age trends. From 2010 to 2018, the number of pre-school age children (age 0 to 4) increased by 23 percent in North Dakota as compared to a 2 percent decrease in the U.S. The number of older children (age 5-17) in North Dakota increased by 18 percent and this age group decreased by one percent in the U.S. The only age group that experienced a decrease from 2010 to 2018 in North Dakota was the 45-64 age group. In addition, the number of older adults (age 65 and older) grew at a slower rate in North Dakota than in the U.S.
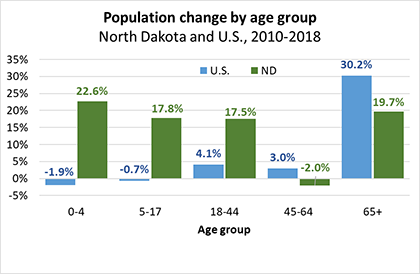
The median age and the age structure in North Dakota are being impacted by migration and the aging baby boomers. Energy development in the western part of the state attracted young people for work. The influx of young people in their prime child-bearing years led to an increase in the number of young adults and an increase of the number of births. The 45 to 64 age cohort saw a decrease in population largely due to the aging baby boomers, as the oldest of this cohort turned 65 in 2011. As a result, the elderly population age 65 and older saw a significant increase from 2010 to 2018.
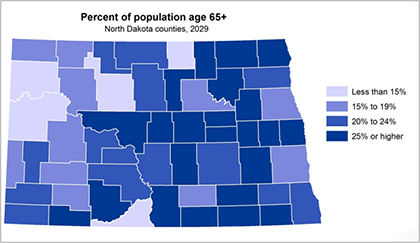
The age structure in ND will continue to change over the next two decades as baby boomers continue to move into retirement years. In 2018, at least one in four residents was age 65 or older in 13 of North Dakota’s 53 counties. According to the Center for Social Research at NDSU population projections, by 2029, at least one in four residents will be age 65 or older in 23 counties. This will have a significant impact on programs and services for the elderly, the health care system, housing stock, and more.

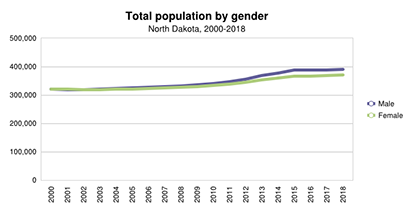
North Dakota is currently one of a few states where males outnumber females. Back in 2000 however, females outnumbered males in the state. From 2003 through 2015, the male population grew, on average, a half percent per year faster than females, resulting in more males than females. After 2015, both the male and female populations remained relatively steady.
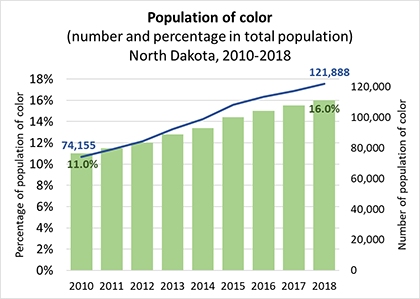
As North Dakota’s population grows, it is becoming increasingly racially and ethnically diverse. Combined, American Indian, Black, Asian, people reporting multiple races, and people who are of Hispanic ethnicity (i.e., of color) in North Dakota comprised 16 percent of the total population in 2018 as compared to 11 percent in 2010. Compared to 2010, North Dakota’s population of color saw a 64.4 percent increase, from 74,155 people in 2010 to 121,888 people in 2018. The increase in the population of color from 2010 to 2018 was by far the largest percentage change of any state. For comparison, the U.S. population of color increased by 16.3 percent for the same time period, 2010 to 2018.
Among the racial and ethnic groups in North Dakota, the Black population experienced the largest increase, from 8,248 in 2010 to 25,620 in 2018 (211% increase). The Hispanic population more than doubled, from 13,467 in 2010 to 29,529 in 2018 (119% increase). The Asian population also nearly doubled from 2010 to 2018 (91% increase). The American Indian population continues to make up the largest minority population in North Dakota (41,962 residents in 2018) and saw a 14 percent increase from 2010 to 2018. For comparison, the white, non-Hispanic population grew 7 percent from 2010 to 2018. However, despite the increase in minority populations, North Dakota was less racially and ethnically diverse than most states (43rd out of 50 states) in 2018.
More population, economic, health, and education trends have been updated on North Dakota Compass under the Major Trends section. Check back often for new data to increase your understanding about a topic, issue, or need! Using reliable data will help you make informed decisions on programs and policies that impact your organizations and communities.
