Ask A Researcher

May 2019

2019 Compass Points: Setting direction for improving the quality of life in North Dakota

Ina Cernusca is a research specialist with the North Dakota Compass project and the Center for Social Research at North Dakota State University. North Dakota Compass provides and promotes the use of reliable, accurate, and unbiased demographic, economic, and socio-economic data to support informed decision-making and community engagement in North Dakota. As a part of the North Dakota Compass team, Ina contributes to the project by creating and implementing strategies to continually grow and improve the quality of the website, by developing and monitoring performance measures, implementing impact evaluation methods, and conducting research projects associated with North Dakota Compass. In this article, Ina highlights the notable trends and data points that appear in North Dakota Compass’ newly released 2019 Compass Points.


North Dakota Compass (ND Compass) just launched its signature publication, the 2019 Compass Points. The annual indicator report includes data and analysis about notable trends, key demographics, and a dashboard look at measures of progress in key topic areas in North Dakota. The report uses the most recent data published by national data sources such as U.S. Census Bureau, U.S. Bureau of Economic Analysis, U.S. Bureau of Labor Statistics, as well as local, state specific data sources like ND Department of Public Instruction, ND Department of Health, ND Secretary of State, and ND Job Service. The goal of this publication is to provide data and analysis to better identify and build understanding about the issues and opportunities facing the state of North Dakota.

The most notable trends highlighted in this year’s report are:

1. North Dakota's population slightly increased in 2018.

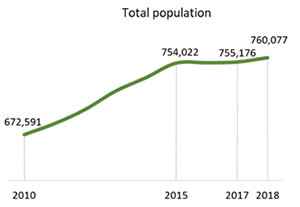
After five years of continuous growth (2010-2015) due to energy development in the western part of the state, North Dakota’s population remained relatively unchanged from 2015 to 2017. However, from 2017 to 2018, North Dakota’s population increased by 4,901 people. The majority of the increase in population was attributed to natural growth (4,656 more births than deaths). The net migration, although small (218), turned positive for the first time since 2015, with more people entering than leaving the state from July 1st 2017 to July 1st 2018. The 0.6 percent increase in population from 2017 to 2018, ranks North Dakota 19th highest among the 50 states in percentage increase during that time period. With the current estimate, North Dakota retains its status as the 47th most populous state, with only Alaska, Vermont, and Wyoming ranking below.

2. Older adults in North Dakota are more educated than 10 years ago.

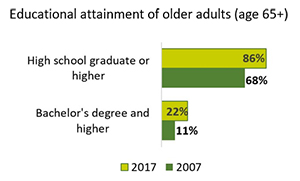
Educational attainment levels of individuals in North Dakota have changed over the recent past. Overall, most age groups are more educated than they were ten years ago, with older adults seeing the largest increase in educational attainment. Compared to 10 years ago, a larger proportion of North Dakota adults age 65 and older have graduated from high school (86% in 2017 compared to 68% in 2007) and attained a bachelor’s degree or higher (22% in 2017 compared to 11% in 2007). Higher levels of education provide older workers with a number of benefits. Older adults with higher educational attainment are more likely to work past retirement age and less likely to be employed in physically-demanding jobs or jobs with difficult working conditions. They also are more likely to have access to flexible work arrangements.

3. North Dakota surpassed all other states in median household income increase over the past decade.

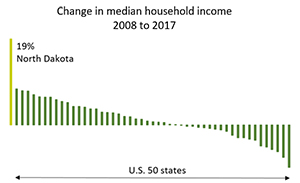
North Dakota’s median household income has substantially risen since 2008 when the most recent oil boom began. After peaking in 2015 and slightly decreasing in 2016, the median household income held at $61,843 in 2017. Overall, the median household income increased 19 percent from 2008 to 2017, by far the largest increase of all 50 U.S. states during the time period. It’s important to note that changes in median household income are not merely the result of the state of the economy, it also reflects changes in household characteristics, such as the size and composition of households, the employment status, and the educational attainment levels of household members, among others.

4. The age structure in North Dakota is changing.

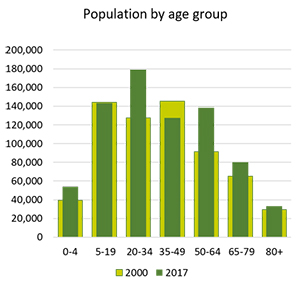
From 2000 to 2017, the number of young children (age 0 to 4) increased by 37 percent and the number of young adults (age 20 to 34) increased by 41 percent. This change was influenced by an increase in the number of births coupled with an influx of young people to the state due to North Dakota’s energy development activities. The aging of the baby boomers and increased life expectancy have led to an increase in population age 50 and older. Specifically, the 50-64 year olds grew by 51 percent, from 91,428 in 2000 to 138,139 in 2017. In contrast, the prime working-age population (age 35 to 49) decreased by 12 percent. These changes bring both opportunities and challenges which could have consequences for the society and the economy. Understanding the age structure of a community is essential to plan for services like schools, housing, healthcare, and transportation.

In addition to the main trends, a dashboard provides key metrics in all topics on the ND Compass website, highlighting how they compare to other states and how they are trending.

In 2017, North Dakota ranked first among the 50 states for…

  • Highest percentage of young children (younger than 6) for whom all parents are working (76.3%)
  • Lowest percentage of households who are cost-burdened from housing (22.8%)
  • Highest percentage of the civilian population (age 16-64) who are employed (79.7%)

North Dakota ranked among the top 5 states for…

  • The percentage of older adults (age 65 and older) who volunteer (41.1%) (3rd highest)
  • The percentage of babies born at low birth weight (6.7%) (4th lowest)
  • The percentage of older adults (age 65 and older) with a disability (30.4%) (5th lowest)

North Dakota ranked among the bottommost states for…

  • The percentage of children (3 and 4 years old) enrolled in preschool (29.4%) (rank 50 out of 50 states)
  • Homeownership rate (63.4%) (rank 40 out of 50 states)

Compared to 2016, North Dakota significantly improved on a number of measures in 2017:

  • Older adults (age 65 and older) with a disability (decreased from 34.2% to 30.4% and from rank 20 among the 50 states to rank 5)
  • Percent of eligible voters who voted in the midterm election (32% increase from 43.8% in 2014 to 57.8% in 2018)
  • Annual change in real Gross Domestic Product (GDP) (from 4.9% decrease in 2016 to 1.0% increase in 2017)

Compared to 2016, North Dakota trended unfavorably on a number of measures:

  • Adults (age 18 and older) who are obese (from 31.9% in 2016 to 33.2% in 2017)
  • Residents (under age 65) who are uninsured (from 8.1% in 2016 to 8.8% in 2017)
  • Median household income for households headed by older adults (age 65 and older) (from$41,889 in 2016 to $41,237 in 2017)

The North Dakota by Numbers section on Compass Points features notable data points in demographics, economy, health, civic engagement, and workforce. Among the data highlighted are:

  • Increase in the population of color in North Dakota from 2010 to 2017 (56.9% increase in North Dakota as compared to 14.8% in the U.S.)
  • Disparity by income in high school graduation rate (73.5% for lower-income students as compared to 91.9% for higher-income students)
  • Five percentage point increase in obesity rates from 2011 to 2017 (from 27.8% in 2011 to 33.2% in 2017
  • Large increase in the number of children racially identified as Black (from 2,780 in 2010 to 7,131 in 2017)

All data for the 2019 Compass Points is provided by North Dakota Compass with the most recent data updated in April 2019. Data sources, years, margins of error, and additional notes are available on ndcompass.org.

Ask a researcher archive

Dean Bangsund and Nancy Hodur. Sugarbeet Industry in the Northern Plains: Economic Contribution in Minnesota and North Dakota.
April 2024

North Dakota Compass. North Dakota Compass Releases the 2024 Compass Points
March 2024

Nicholas Bauroth. City Governance: Commission or Council for Fargo, North Dakota?
February 2024

Ina Cernusca. 2024 Brings a NEW Visualization Tool and Data Updates to the North Dakota State Legislative District Profiles.
January 2024

Samuel Faraday Saidu and Chelsey Hukriede. Strapped for Safety: Exploring Insights into Car Seat Knowledge Among North Dakota Mothers.
December 2023

Debarati Kole and Kendra Erickson-Dockter. A Comprehensive Look at the Multifaceted Risk Factors of Postpartum Depression
October 2023

Valquiria F. Quirino and Avram Slone. COVID-19 pandemic in North Dakota: Significance, progression, and government response.
September 2023

Karen Olson. The Lasting Impact of Maternal Childhood Trauma
August 2023

Avram Slone. The Social Variability of COVID-19 Mortality in North Dakota between March 11th, 2020 and February 13th, 2022
July 2023

Nancy Hodur and Dean Bangsund. Agriculture a Key Driver in the North Dakota economy
June 2023

Karen Olson. Health and Well-Being in North Dakota. Understanding how the five social determinants of health are impacting the ability of North Dakotans to thrive
May 2023

Kendra Erickson-Dockter. North Dakota Compass: 10 years of Measuring Progress and Inspiring Action.
April 2023

Hannah Hanson & Grace Njau. Every Dad Counts: North Dakota Fatherhood Experiences Survey
March 2023

Nancy Hodur. Housing Market Conditions and Declining Homeownership Rates
February 2023

North Dakota Compass. 2022 Recap: Data highlighted throughout the year
January 2023

Kendra Erickson-Dockter. A Look into a Chronic Condition and Pregnancy: Preexisting Diabetes PRAMS Points 2022
December 2022

Nancy Hodur and Karen Olson. Lower-income households and baby boomers, main drivers for North Dakota housing needs in the near term
November 2022

Avram Slone. The Impact of COVID-19 on Group Quarters in North Dakota
October 2022

Chelsey Hukriede. Safe Sleep PRAMS Points 
September 2022

Kendra Erickson-Dockter. Gestational Diabetes PRAMS Points – A NEW Dashboard Format!
August 2022

Aastha Bhandari, Debarati Kole, Dr. Nancy Hodur. Mission Of Mercy: Giving hope through a smile.
July 2022

Ina Cernusca.Households with children have been disproportionately affected by the COVID-19 pandemic, especially in the first year of the pandemic.
May 2022

Andy Wiese and Karen Olson. One Health System’s Approach to Improving Community Health. Understanding what the 2021 Community Health Needs Assessment Conducted by Sanford Health means for population health
April 2022

Mariel Lopez-Valentin and Grace Njau. North Dakota Title X, Family Planning Needs Assessment
January 2022

Nancy Hodur and Dean Bangsund. North Dakota Lignite Energy Industry Workforce
December 2021

Ina Cernusca. Vaccine Acceptance and Hesitancy in North Dakota
October 2021

Nancy Hodur and Karen Olson. Rural Communities Will Benefit from a New Cooperative in Walsh County
September 2021

Matt Schmidt and Grace Njau. COVID-19 Trends Among North Dakota Children, March 2020 – March 2021
August 2021

Kendra Erickson-Dockter and Ina Cernusca. COVID Hardship on North Dakota Households: New study on the impacts on North Dakota households that lost employment income during the pandemic
July 2021

Chelsey Hukriede and Kendra Erickson-Dockter. NEW! PRAMS Points – A Brief Infographic using North Dakota PRAMS Survey Data
May 2021

North Dakota Compass: A look inside the 2021 Compass Points
April 2021

Ina Cernusca: Households with children are disproportionately affected by the COVID-19 pandemic
March 2021

Ina Cernusca: Differences in COVID-19 Risk Factors at District Level
February 2021

Kendra Erickson-Dockter, Chelsey Hukriede, and Grace Njau: An Introduction to the North Dakota Study of Associated Risks of Stillbirth (SOARS)
October 2020

Karen Ehrens: North Dakota Families are Facing Food and Other Hardships in the Wake of COVID-19 Pandemic, and Helpers Respond
September 2020

Ina Cernusca: Taking the pulse of North Dakota households during the COVID-19 pandemic.
July 2020

Nancy Hodur:Challenges of Grocery Stores in Rural North Dakota
May 2020

North Dakota Compass:2020 Compass Points: Measuring progress. Inspiring action.
March 2020

Amy Tichy:Student Veterans in the College Classroom.
February 2020

North Dakota Compass:North Dakota Compass launches the 2020 State Legislative District Profiles
January 2020

Grace Njau, Nancy Hodur:&Chelsey Hukriede: Risk Behaviors among Women with a Recent Live Birth in North Dakota: Findings from the 2017 North Dakota Pregnancy Risk Assessment Monitoring System (PRAMS)
November 2019

Ina Cernusca:& Karen Olson: Behind the scenes – The story of the North Dakota State Legislative District Profiles
October 2019

Ina Cernusca: Key demographic trends in North Dakota.
August 2019

Karen Olson: The 30th edition of the Annie E. Casey Foundation’s KIDS COUNT® Data Book finds that 175,772 children will shape the future of a more diverse North Dakota.
July 2019

Shweta Arpit Srivastava & Dr. Ann Burnett: “Giving rope and pulling it back”: Parental dilemmas to prevent adolescent substance use
June 2019

Ina Cernusca: 2019 Compass Points: Setting direction for improving the quality of life in North Dakota
May 2019

Joshua Marineau and Onnolee Nordstrom: Learning from Fargo -- An Exploration of the Fargo-Moorhead Entrepreneurial Ecosystem
March 2019

Nancy Hodur: Improving Oral Health for Older Adults in North Dakota
November 2018

Rachelle Vettern: Engaging Volunteers across Generations
October 2018

Karen Olson: The 2018 KIDS COUNT® Data Book reveals strengths and challenges for children in North Dakota – and emphasizes that an inaccurate census in 2020 threatens to worsen existing challenges for North Dakota youth
July 2018

Lori Capouch: Is food access a concern in rural North Dakota?
May 2018

Deb Nelson: Williston Basin 2016: Employment, Population, and Housing Forecasts – An Overview
January 2018

Karen Olson: North Dakota among Top 10 States in Country for Child Well-Being
July 2017

Nancy Hodur: SEAL!North Dakota: A School Dental Sealant Program
June 2017

Grace Njau: A Brief Introduction to the North Dakota Pregnancy Risk Assessment Monitoring System (PRAMS)
April 2017

Ina Cernusca: North Dakota’s Women study: A brief overview
March 2017

Dean Bangsund: Effects of Fargo-Moorhead Area Diversion on Spring Planting for Producers
February 2017

Deb Nelson: Vision West: Leading, Educating, and Collaborating to Mobilize the 19 Western North Dakota Counties Towards Resilience and Prosperity
December 2016

Nancy Hodur: North Dakota Statewide Housing Needs Assessment: A Brief Overview of the Population and Housing Forecast component
November 2016

Social Isolation: Experiential Narratives of African Refugee Women in the Fargo-Moorhead Community
September 2016

Sean Brotherson: Father Involvement and the Future of Children and Families
July 2016

Carol Cwiak: Bakken Oil: What Have We Learned and What Will We Do Differently Next Time
June 2016

Jessica Creuzer: The Changing Face of Western North Dakota: What are the Effects of Increased Travel from Energy Development
April 2016

ND Compass: City Profiles
February 2016

ND Department of Health: Making Change Happen
January 2016

Jennifer Weber: A Bold New Direction for the North Dakota University System - The NDUS Edge Dashboards
December 2015

Wendy Troop-Gordon: What Has Science Taught Us About Bullying?
November 2015

ND Compass: A Look at the Youngest North Dakotans
October 2015

Kendra Erickson-Dockter: Growing Older in North Dakota
September 2015

Michael Ziesch: Data You Can Trust: The Labor Market Information Center
August 2015

Malini Srivastava and Troy Raisanen: efargo: City Scale Sustainability
July 2015

Kevin Iverson: The State Repository of Census Information- The North Dakota Census
June 2015

Wonwoo Byun: Reducing Sedentary Behavior is a Key for Obesity Prevention in Children
May 2015

Kathryn Gordon: The Science of Suicide Prevention
April 2015

ND Compass: Tell a Story with Data! The Importance of Crade-to-Career Success
March 2015

Abby Gold: Community Food Systems: Food Charters and More
February 2015

Heather Fuller-Iglesias: The Importance of Recognizing the Role of Social Support in Human Development Across the Lifespan
January 2015

Michael Carbone: Using Data to End Homelessness
December 2014

Randal Coon: Tribal Colleges Contribute to the State's Economy
November 2014

Deb White: Women's Representation in Elected Office
October 2014

Randal Coon: Pull Factors Measure Retail Trade Performance
September 2014

Karen Olson: North Dakota ranks Well Nationally with Regard to Overall Child Well-Being; However, Substantial Opportunities for Improvement Exist
August 2014

Julie Garden-Robinson: Guard Against Grilling Gaffes: Healthy Grilling and Food Safety Tips
July 2014

Michael Noone: Extreme Weather Patterns- North Dakota Has It All
June 2014

Kathleen Tweeten: Why All Community Development Decisions Should Use the Community Capitals Framework
May 2014

Clayton Hilmert: Stress effects on pregnancy: The impact of the 2009 Red River flood on birth weight
April 2014

Karen Ehrens: Food Deserts and how they impact North Dakota
March 2014

Gretchen Dobervich and Kendra Erickson-Dockter: New Geographic Profiles: How they can work for you
February 2014

Compass Staff: "New Compass Team Brings Changes in 2014"
January 2014

Donna Grandbois: "Fargo-Moorhead American Indian Community-Sponsored Health Needs Assessment"
November 2013

Karen Olson: "North Dakota KIDS COUNT - why it counts for you
October 2013

Nancy Hodur: "Western North Dakota School Administrators Face Challenges"
August 2013

Megan Chmielewski: "Annual population estimates tell interesting stories about North Dakota's growth patterns"
July 2013

Ramona Danielson: "Learn how to make the ND Compass website work for you"
May 2013

Karen Olson: "About the American Community Survey (ACS)"
February 2013

North Dakota Compass

Center for Social Research
North Dakota State University

Compass created by:
Wilder Research

© 2024. All rights reserved.