Ask A Researcher

March 2020

2020 Compass Points: Measuring Progress. Inspiring Action.

North Dakota Compass provides and promotes the use of reliable, accurate, and unbiased demographic, economic, and socio-economic data to support informed decision-making and community engagement in North Dakota. The North Dakota Compass team promotes the use of quality data through presentations, workshops, newsletters, and social media. This article highlights the notable trends and data points that appear in the newly released 2020 Compass Points.


North Dakota Compass (ND Compass) just launched its signature publication, the 2020 Compass Points. The annual indicator report includes data and analysis about notable trends, key demographics, and a dashboard look at measures of progress in key topic areas in North Dakota. The Compass Points captures the current state of North Dakota, the state in relation to other states, and measures progress over time. The report uses the most recent data published by national data sources such as U.S. Census Bureau, U.S. Bureau of Economic Analysis, U.S. Bureau of Labor Statistics, as well as local, state specific data sources like ND Department of Public Instruction, ND Department of Health, ND Secretary of State, and ND Job Service. The goal of this publication is to provide data and analysis to better identify and build understanding about the issues and opportunities facing the state of North Dakota.

Key Trends

The most notable trends highlighted in this year’s report are:

1. Economic development had a substantial impact on the number of births in the past decade.

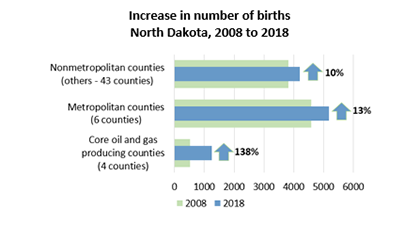
Rapid growth in the oil and gas sector coupled with diverse urban economic development has attracted young people to North Dakota. This increase in the young population has led to an increase in the number of births statewide from 8,931 in 2008 to 10,630 in 2018.

The number of births more than doubled in the four core oil and gas producing counties (721 more births or 138% increase). Metropolitan counties also experienced an increase of 585 births (13%) from 2008 to 2018. This trend has not been consistent throughout the state. While the remainder of the state increased the number of births by 393 (10%) overall, 17 counties experienced a decrease in the number of births from 2008 to 2018. The increase in the number of births has multiple ramifications as communities address current and future demand for child care, youth programs and activities, and schools.

2. Jobs creation in North Dakota far outpaced national averages but workforce challenges persist.

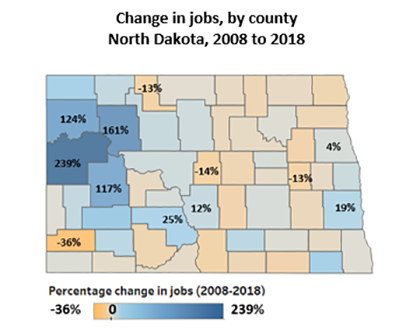
The number of jobs in North Dakota has increased by 19 percent from 2008 to 2018, outpacing national job growth of 8 percent. The number of jobs increased by 117 percent to 239 percent in core oil and gas producing counties and 4 to 25 percent in metropolitan areas. However, 25 rural, sparsely populated counties lost jobs during the same time period.

Filling open jobs has been challenging. Unemployment rates statewide remain some of the lowest in the country (2.6 % in 2018) and workforce participation rates (percentage of adults, age 16-64, who are working) remain among the highest (78.8% in 2018). All North Dakota’s counties reported more job openings than active résumés (0.27 active résumés per job opening overall), in January 2020.

3. Most historically disadvantaged students showed progress in on-time high school graduation rate.

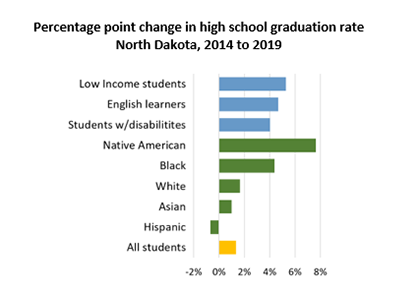
Most student groups in North Dakota saw an increase in on-time high school graduation rate in the past five years. Native American students, who have the lowest graduation rate among racial and ethnic groups (72.2%), posted a 7.6 percentage point increase in graduation rate from 2014 to 2019. During the same time period, the graduation rate for black students increased 4.4 percentage points. Among other groups, the graduation rate also increased for low income students, English learners, and students with disabilities (5.3, 4.6, and 4.1 percentage points, respectively).

While progress for the most historically disadvantaged student groups is notable, substantial disparity in graduation rates exists between students with a disadvantaged status and their counterparts.

4. The North Dakota adult obesity rate increased to the 8th highest in the nation.

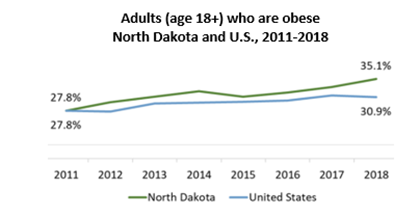
In 2011, 27.8 percent of North Dakota’s adults (age 18 and older) were obese, ranking North Dakota 25th among the 50 states. Seven years later, in 2018, the adult obesity rate rose to 35.1 percent, raising North Dakota's ranking to the 8th highest in the nation.

The North Dakota obesity rate has trended above the national average since 2011.

State of the State Dashboard

In addition to the main trends, a dashboard provides key metrics in all topics on the ND Compass website, highlighting how North Dakota compares to other states and how the state is trending.

In 2018, North Dakota ranked first among the 50 states for…

  • Lowest percentage of households who are cost-burdened from housing (22.8%)
  • Real compound annual growth rate of GDP (4.3%)

North Dakota ranked among the top 5 states for…

  • The percentage of babies born at low birth weight (6.6% - 2nd lowest)
  • The percentage of the civilian population (age 16-64) who are employed (78.8% - 2nd highest)
  • The percentage of older adults (age 65 and older) who volunteer (41.1% - 3rd highest)

North Dakota ranked among the bottommost states for…

  • The percentage of children (3 and 4 years old) enrolled in preschool (37.2% - rank 48 out of 50 states, from highest to lowest percentage)

Compared to the previous year, North Dakota significantly improved on ...

  • Percentage of children enrolled in preschool (increased from 29.4% in 2017 to 37.2% in 2018)
  • Percent of eligible voters who voted in the midterm election (increased from 43.8% in 2014 to 57.8% in 2018)
  • Annual change in real Gross Domestic Product (GDP) (from 0.0% change in 2017 to 3.6% increase in 2018)
  • Third grade students proficient in reading (increased form 46.0% in 2018 to 48.0% in 2019)
  • Eight grade students proficient in math (increased from 44.0% in 2018 to 47.0% in 2019)
  • Total nonfarm payroll jobs (increased from 430,800 in 2017 to 433,400 in 2018)

Compared to the previous year, North Dakota trended unfavorably on ...

  • Older adults (age 65 and older) with a disability (increased from 30.4% in 2017 to 33.4% in 2018)

The North Dakota by Numbers section on Compass Points features notable data points in demographics, economy, health, civic engagement, and workforce. Among the data highlighted are:

  • Increase in the population of color in North Dakota from 2010 to 2018 (64% increase in North Dakota as compared to 16% in the U.S.)
  • North Dakota was the only state in 2018 with a median age younger than in 2010 (35.2 years)
  • Increase in the median household income in North Dakota from 2000 to 2018 (20%), the largest percentage increase of any state
  • Increase in number of children (age 0-17) from 2010 to 2019 (20%), the largest percentage increase of any state
  • Poverty rate by county ranges from 7% to 33%.

Data for the 2020 Compass Points is provided by North Dakota Compass with the most recent data updated in February 2020. Data sources, years, margins of error, and additional notes are available on ndcompass.org.

Download the 2020 Compass Points.

Browse ndcompass.org for more actionable data and trends.

Ask a researcher archive

Dean Bangsund and Nancy Hodur. Sugarbeet Industry in the Northern Plains: Economic Contribution in Minnesota and North Dakota.
April 2024

North Dakota Compass. North Dakota Compass Releases the 2024 Compass Points
March 2024

Nicholas Bauroth. City Governance: Commission or Council for Fargo, North Dakota?
February 2024

Ina Cernusca. 2024 Brings a NEW Visualization Tool and Data Updates to the North Dakota State Legislative District Profiles.
January 2024

Samuel Faraday Saidu and Chelsey Hukriede. Strapped for Safety: Exploring Insights into Car Seat Knowledge Among North Dakota Mothers.
December 2023

Debarati Kole and Kendra Erickson-Dockter. A Comprehensive Look at the Multifaceted Risk Factors of Postpartum Depression
October 2023

Valquiria F. Quirino and Avram Slone. COVID-19 pandemic in North Dakota: Significance, progression, and government response.
September 2023

Karen Olson. The Lasting Impact of Maternal Childhood Trauma
August 2023

Avram Slone. The Social Variability of COVID-19 Mortality in North Dakota between March 11th, 2020 and February 13th, 2022
July 2023

Nancy Hodur and Dean Bangsund. Agriculture a Key Driver in the North Dakota economy
June 2023

Karen Olson. Health and Well-Being in North Dakota. Understanding how the five social determinants of health are impacting the ability of North Dakotans to thrive
May 2023

Kendra Erickson-Dockter. North Dakota Compass: 10 years of Measuring Progress and Inspiring Action.
April 2023

Hannah Hanson & Grace Njau. Every Dad Counts: North Dakota Fatherhood Experiences Survey
March 2023

Nancy Hodur. Housing Market Conditions and Declining Homeownership Rates
February 2023

North Dakota Compass. 2022 Recap: Data highlighted throughout the year
January 2023

Kendra Erickson-Dockter. A Look into a Chronic Condition and Pregnancy: Preexisting Diabetes PRAMS Points 2022
December 2022

Nancy Hodur and Karen Olson. Lower-income households and baby boomers, main drivers for North Dakota housing needs in the near term
November 2022

Avram Slone. The Impact of COVID-19 on Group Quarters in North Dakota
October 2022

Chelsey Hukriede. Safe Sleep PRAMS Points 
September 2022

Kendra Erickson-Dockter. Gestational Diabetes PRAMS Points – A NEW Dashboard Format!
August 2022

Aastha Bhandari, Debarati Kole, Dr. Nancy Hodur. Mission Of Mercy: Giving hope through a smile.
July 2022

Ina Cernusca.Households with children have been disproportionately affected by the COVID-19 pandemic, especially in the first year of the pandemic.
May 2022

Andy Wiese and Karen Olson. One Health System’s Approach to Improving Community Health. Understanding what the 2021 Community Health Needs Assessment Conducted by Sanford Health means for population health
April 2022

Mariel Lopez-Valentin and Grace Njau. North Dakota Title X, Family Planning Needs Assessment
January 2022

Nancy Hodur and Dean Bangsund. North Dakota Lignite Energy Industry Workforce
December 2021

Ina Cernusca. Vaccine Acceptance and Hesitancy in North Dakota
October 2021

Nancy Hodur and Karen Olson. Rural Communities Will Benefit from a New Cooperative in Walsh County
September 2021

Matt Schmidt and Grace Njau. COVID-19 Trends Among North Dakota Children, March 2020 – March 2021
August 2021

Kendra Erickson-Dockter and Ina Cernusca. COVID Hardship on North Dakota Households: New study on the impacts on North Dakota households that lost employment income during the pandemic
July 2021

Chelsey Hukriede and Kendra Erickson-Dockter. NEW! PRAMS Points – A Brief Infographic using North Dakota PRAMS Survey Data
May 2021

North Dakota Compass: A look inside the 2021 Compass Points
April 2021

Ina Cernusca: Households with children are disproportionately affected by the COVID-19 pandemic
March 2021

Ina Cernusca: Differences in COVID-19 Risk Factors at District Level
February 2021

Kendra Erickson-Dockter, Chelsey Hukriede, and Grace Njau: An Introduction to the North Dakota Study of Associated Risks of Stillbirth (SOARS)
October 2020

Karen Ehrens: North Dakota Families are Facing Food and Other Hardships in the Wake of COVID-19 Pandemic, and Helpers Respond
September 2020

Ina Cernusca: Taking the pulse of North Dakota households during the COVID-19 pandemic.
July 2020

Nancy Hodur:Challenges of Grocery Stores in Rural North Dakota
May 2020

North Dakota Compass:2020 Compass Points: Measuring progress. Inspiring action.
March 2020

Amy Tichy:Student Veterans in the College Classroom.
February 2020

North Dakota Compass:North Dakota Compass launches the 2020 State Legislative District Profiles
January 2020

Grace Njau, Nancy Hodur:&Chelsey Hukriede: Risk Behaviors among Women with a Recent Live Birth in North Dakota: Findings from the 2017 North Dakota Pregnancy Risk Assessment Monitoring System (PRAMS)
November 2019

Ina Cernusca:& Karen Olson: Behind the scenes – The story of the North Dakota State Legislative District Profiles
October 2019

Ina Cernusca: Key demographic trends in North Dakota.
August 2019

Karen Olson: The 30th edition of the Annie E. Casey Foundation’s KIDS COUNT® Data Book finds that 175,772 children will shape the future of a more diverse North Dakota.
July 2019

Shweta Arpit Srivastava & Dr. Ann Burnett: “Giving rope and pulling it back”: Parental dilemmas to prevent adolescent substance use
June 2019

Ina Cernusca: 2019 Compass Points: Setting direction for improving the quality of life in North Dakota
May 2019

Joshua Marineau and Onnolee Nordstrom: Learning from Fargo -- An Exploration of the Fargo-Moorhead Entrepreneurial Ecosystem
March 2019

Nancy Hodur: Improving Oral Health for Older Adults in North Dakota
November 2018

Rachelle Vettern: Engaging Volunteers across Generations
October 2018

Karen Olson: The 2018 KIDS COUNT® Data Book reveals strengths and challenges for children in North Dakota – and emphasizes that an inaccurate census in 2020 threatens to worsen existing challenges for North Dakota youth
July 2018

Lori Capouch: Is food access a concern in rural North Dakota?
May 2018

Deb Nelson: Williston Basin 2016: Employment, Population, and Housing Forecasts – An Overview
January 2018

Karen Olson: North Dakota among Top 10 States in Country for Child Well-Being
July 2017

Nancy Hodur: SEAL!North Dakota: A School Dental Sealant Program
June 2017

Grace Njau: A Brief Introduction to the North Dakota Pregnancy Risk Assessment Monitoring System (PRAMS)
April 2017

Ina Cernusca: North Dakota’s Women study: A brief overview
March 2017

Dean Bangsund: Effects of Fargo-Moorhead Area Diversion on Spring Planting for Producers
February 2017

Deb Nelson: Vision West: Leading, Educating, and Collaborating to Mobilize the 19 Western North Dakota Counties Towards Resilience and Prosperity
December 2016

Nancy Hodur: North Dakota Statewide Housing Needs Assessment: A Brief Overview of the Population and Housing Forecast component
November 2016

Social Isolation: Experiential Narratives of African Refugee Women in the Fargo-Moorhead Community
September 2016

Sean Brotherson: Father Involvement and the Future of Children and Families
July 2016

Carol Cwiak: Bakken Oil: What Have We Learned and What Will We Do Differently Next Time
June 2016

Jessica Creuzer: The Changing Face of Western North Dakota: What are the Effects of Increased Travel from Energy Development
April 2016

ND Compass: City Profiles
February 2016

ND Department of Health: Making Change Happen
January 2016

Jennifer Weber: A Bold New Direction for the North Dakota University System - The NDUS Edge Dashboards
December 2015

Wendy Troop-Gordon: What Has Science Taught Us About Bullying?
November 2015

ND Compass: A Look at the Youngest North Dakotans
October 2015

Kendra Erickson-Dockter: Growing Older in North Dakota
September 2015

Michael Ziesch: Data You Can Trust: The Labor Market Information Center
August 2015

Malini Srivastava and Troy Raisanen: efargo: City Scale Sustainability
July 2015

Kevin Iverson: The State Repository of Census Information- The North Dakota Census
June 2015

Wonwoo Byun: Reducing Sedentary Behavior is a Key for Obesity Prevention in Children
May 2015

Kathryn Gordon: The Science of Suicide Prevention
April 2015

ND Compass: Tell a Story with Data! The Importance of Crade-to-Career Success
March 2015

Abby Gold: Community Food Systems: Food Charters and More
February 2015

Heather Fuller-Iglesias: The Importance of Recognizing the Role of Social Support in Human Development Across the Lifespan
January 2015

Michael Carbone: Using Data to End Homelessness
December 2014

Randal Coon: Tribal Colleges Contribute to the State's Economy
November 2014

Deb White: Women's Representation in Elected Office
October 2014

Randal Coon: Pull Factors Measure Retail Trade Performance
September 2014

Karen Olson: North Dakota ranks Well Nationally with Regard to Overall Child Well-Being; However, Substantial Opportunities for Improvement Exist
August 2014

Julie Garden-Robinson: Guard Against Grilling Gaffes: Healthy Grilling and Food Safety Tips
July 2014

Michael Noone: Extreme Weather Patterns- North Dakota Has It All
June 2014

Kathleen Tweeten: Why All Community Development Decisions Should Use the Community Capitals Framework
May 2014

Clayton Hilmert: Stress effects on pregnancy: The impact of the 2009 Red River flood on birth weight
April 2014

Karen Ehrens: Food Deserts and how they impact North Dakota
March 2014

Gretchen Dobervich and Kendra Erickson-Dockter: New Geographic Profiles: How they can work for you
February 2014

Compass Staff: "New Compass Team Brings Changes in 2014"
January 2014

Donna Grandbois: "Fargo-Moorhead American Indian Community-Sponsored Health Needs Assessment"
November 2013

Karen Olson: "North Dakota KIDS COUNT - why it counts for you
October 2013

Nancy Hodur: "Western North Dakota School Administrators Face Challenges"
August 2013

Megan Chmielewski: "Annual population estimates tell interesting stories about North Dakota's growth patterns"
July 2013

Ramona Danielson: "Learn how to make the ND Compass website work for you"
May 2013

Karen Olson: "About the American Community Survey (ACS)"
February 2013

North Dakota Compass

Center for Social Research
North Dakota State University

Compass created by:
Wilder Research

© 2024. All rights reserved.