Ask A Researcher
October 2019
Behind the scenes – The story of the North Dakota State Legislative District Profiles.
![]()
Ina Cernusca is a research specialist within the Center for Social Research at NDSU and the Project Director for North Dakota Compass. North Dakota Compass provides a curated collection of reliable, accurate, and unbiased demographic and socio-economic data on a variety of topics to support decision making and community engagement in North Dakota.
Karen Olson is an information specialist and the Program Director for North Dakota KIDS COUNT. Sponsored by the Annie E. Casey Foundation, North Dakota KIDS COUNT measures the educational, social, economic, and physical well-being of children in North Dakota in order to inform local and state discussions about how to secure better futures for all of North Dakota’s children.
North Dakota Compass and North Dakota KIDS COUNT are both housed at the Center for Social Research at NDSU. In this article, Ina and Karen go behind the scenes and reveal the process of creating the North Dakota State Legislative District Profiles.
In the past 10 years, North Dakota’s population increased by 16 percent, and became younger and more diverse. However, these changes have not been consistent across the state. Each community faces unique challenges and opportunities. It is imperative for decision makers and residents to have current and reliable data and information to understand the changes in demographics and the socio-economic conditions in their own community.
Two social indicator programs, both located at the Center for Social Research at NDSU, provide reliable, accurate, and unbiased data to support decision making in North Dakota. North Dakota Compass, with funding from the Bush Foundation, Otto Bremer Trust, and a membership program, provides curated data across multiple topic areas which include children and youth, early childhood, education, the aging population, civic engagement, health, housing, the environment, and the economy. More focused, North Dakota KIDS COUNT, sponsored by the Annie E. Casey Foundation, is part of a national and state-by-state effort to track the well-being of children in order to provide high quality, unbiased information and encourage action on behalf of children and families.
With a common mission, these two programs collaborate on multiple projects and one of our collaborations is the annual North Dakota Legislative District Profiles. The profiles are intended to encourage dialogue among legislators, members of government agencies, community-based organizations, educators, individuals, and businesses about how to best support communities and residents in North Dakota. The profiles add value to both of our programs by providing data at a different level of geography than they historically provided (i.e., state, planning region, tribal area, and county).
The State Legislative District Profiles were first produced in 2014 and are updated annually. We started by selecting indicators that would present strengths and challenges in each district. Indicators were identified based on research, best practices, and the experience we had with our indicator projects. In selecting the indicators, data were chosen based on the validity of the data source, availability over time and by district, and comparability with state and national-level data.
As the premier source of data for detailed population and housing information, the U.S. Census Bureau’s American Community Survey (ACS) 5-Year Data are used for 15 out of the 16 indicators in each profile. The ACS collects data on an ongoing basis and releases new data every year in the form of estimates at different levels of geography. The 5-year estimates are based on 60 months of collected data. For example, the 2013-2017 ACS 5-year estimates use data collected between January 1, 2013 and December 31, 2017. Collecting data over a 5-year period produces a large enough sample for reliable results and is available for all geographies down to the block group level. The limitations of using this data source are that data aggregated over a 5-year period tends to flatten year-to-year changes and extends these effects across years. Consecutive 5-year estimates contain four years of overlapping coverage. For example, the 2013–2017 ACS 5-year estimates share sample data from 2013 through 2016 with the 2012– 2016 ACS 5-year estimates. Thus, when comparing data over time, it is recommended to compare non-overlapping time periods (e.g., 2008-2012 with 2013-2017).
The data source for the remainder indicator (Average EITC Credit) is the Brookings Institution, Earned Income Tax Credit Interactive and Resources feature that provides information on the EITC-eligible population.
The 16 indicators were grouped into four categories: Population, Household, Social, and Economic. Following is a brief description of the categories, indicators, and some reasons for selecting them:
POPULATION
Total population reflects the total number of residents in the district. It is important to track total population, especially towards the end of the decennial when districts may no longer be of equal size. Because of the differential population growth in North Dakota, districts that were about 14,000 people each in 2010, ranged from 13,100 to 22,000 in 2017.
Median age represents the central age point of the resident population, the age where half of the population is younger and half is older. While North Dakota is the only state where the median age in 2018 was younger than in 2010, the median age of North Dakota’s districts ranges from 21.9 years to 49 — and it is important to know where each district stands in that range.
Number and percentage of children are important in planning for services, schools, and businesses, especially since North Dakota is experiencing one of the fastest growing child populations in the nation.
Number and percentage of older adults (age 65 and older) becomes increasingly important as the baby boom generation, which began turning 65 in 2011, is expected to grow significantly over the next 10 years. This cohort will continue to have a significant impact on our communities throughout the state.
HOUSEHOLDS
Total households represents the total number of occupied housing units in the district and was included as a base for comparison and calculations.
Average household size. This indicator reflects the average number of people living in each household. Currently there are approximately 2.31 persons in each North Dakota household – compared to 2.63 nationally. At the district level, the average household size ranges from 1.87 to 3.06. This is an important indicator to track as it impacts issues such as changing housing needs within a community.
Householders living alone represents the number of households occupied by a single person living by themselves. This is another important indicator used to track the changing housing needs within a district as well as to assess the needs of those living alone, especially the elderly.
Average EITC Credit lists the average credit received among householders claiming the federal Earned Income Tax Credit (EITC) in dollars and the number of households taking advantage of the EITC. Earned Income Tax Credit is an anti-poverty effort for low income working families that reduces the amount of taxes owed and may also provide a refund. It helps working families avoid poverty and the hardships it imposes by reducing taxes owed and allowing them to keep more of what they earn.
SOCIAL
Education was an important indicator to include. North Dakota ranks well with regard to individuals having a higher education. Currently 42 percent of adults in North Dakota have at least an Associate’s degree as compared to 39 percent nationally. At the district level, the percentage of adults with an Associate’s degree or higher ranges from 30 percent to 63 percent. Since the unemployment rate is very low in North Dakota and there is an increase in job openings that require technical school degrees and Associates’ degrees, it is important to know what it is available in a given area.
Moved in the past year provides the number and percentage of residents ages 1 and older who moved from a different house within the past year. Mobility and migration are important topics in North Dakota. After decades of outmigration, many counties are now seeing net in-migration, especially in the western part of the state.
Because research clearly indicates that quality early education is critical to the social, emotional, and cognitive development of children, we included the number and percentage of children ages 3 and 4 enrolled in an early education program. This is especially important since North Dakota ranks last among the 50 states for the percentage of 3 and 4 year olds enrolled in preschool.
The disability measure provides perspective on the number of individuals living with some difficulty in vision, hearing, movement, or cognition. This can play an important role in understanding the need for housing options, such as living and aging in place – and spark further discussion regarding policies or building incentives that might allow this to happen.
ECONOMIC
Median household income represents the central income point of the total number of households, including those with no income, and it is a gauge of the overall economic health of the region and the financial resources of its residents.
Low income, below 200% of poverty. This is a key measure in the Economic section and reflects the number of people with a household income below 200 percent of the federal poverty level. We chose this indictor, as opposed to the number and percentage of people living below 100 percent of the poverty level, because research shows that families need an income of approximately twice the official poverty threshold (i.e., 200% of poverty) to cover the entire cost of basic expenses for housing, food, transportation, health care, and child care. The percentage of people living in or near poverty is a measure of the overall economic health of a region. It also indicates the level of need for social and government supports. In North Dakota, 26 percent of people live in households earning less than twice the poverty threshold (i.e., incomes less than 200% of poverty). At a legislative district level, this indicator ranges from 10 percent to 57 percent in North Dakota.
Children younger than 6 years old with all parents working was chosen as an approximation for child care demand. Most North Dakota parents work. And most children have a parent who works full-time, year-round. Thus, quality early care and education is critical in North Dakota communities – it is a necessity for working parents and critical for building the social, emotional, and cognitive skills to prepare children for school. These early experiences create a foundation for children to be successful students and productive adults.
Number and percentage of adults, ages 0 to 64, without health insurance. Individuals without health insurance have limited access to health care (whether preventive or ongoing) which can lead to a greater risk of illness and hospitalization. In addition, a lack of health insurance for children can have a negative influence on school attendance and participation in extracurricular activities, and increased financial and emotional stress among parents.
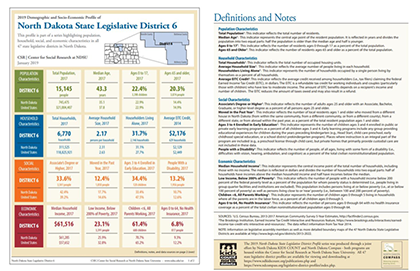
After the indicator selection process was complete, we began designing the profiles. Included on the top of each profile is a map of the district boundaries along with a state map that places the district in context. The 16 indicators are displayed on the front page and grouped into four, color-coded categories. Each indicator is compared to North Dakota and the U.S. On the back of each profile, we included definitions, data sources, and notes relevant to each indicator.
In 2019, we also created interactive maps for each indicator and grouped them by category. The maps add value to the individual district profiles by having all the information on a map to easily compare district with district. The legend is especially helpful to see how much variation there is among districts.
The profiles are updated every year in December and launched early January. We actively promote their launch on the North Dakota Compass and North Dakota KIDS COUNT websites, email lists, and social media outlets.
We invite you to explore the annual North Dakota Legislative District Profiles in the map or profile format (on ND Compass or ND KIDS COUNT ) for a good snapshot of the characteristics of community residents within each state legislative district in North Dakota. They are useful for legislators to better understand the people they represent, to gain insight through reputable data that would otherwise have been difficult to find, and to understand the strengths and challenges of the district they represent. The profiles are also useful for district residents to better understand the neighborhood in which they live – and better inform and educate themselves on the topics considered.
Center for Social Research
North Dakota State University
Compass created by:
Wilder Research
© 2024. All rights reserved.