Data highlight
DECEMBER 15, 2017
North Dakota homeownership rate starts to rebound in 2016.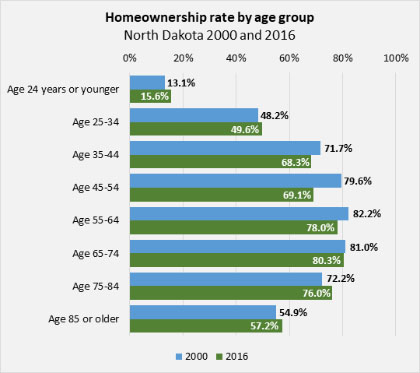
After a decade of stability, the homeownership rate in North Dakota slightly decreased year to year from 2010 to 2015 and reached a low of 61.7 percent in 2015. However, the homeownership rate increased to 63.2 percent in 2016 with 5,866 more homeowner households than in 2015.
Nationwide, North Dakota ranked 40th in 2016 for the percent of housing occupants who owned their homes (rank of one being the highest percentage). North Dakota’s relatively low rate of homeownership is partially due to the large influx of young adults into the state, especially between the years 2010 and 2015, as they are more likely to rent than to own a home. In general, the homeownership rate is lower for younger age groups and increases with age up to age 75. While only one in six young householders (age 24 and younger) owned a home in 2016, one in two householders in the 25 to 34 age group owned a home. The homeownership rate continues to increase to 80 percent for householders age 65 to 74.
Compared to 2000, homeownership rates slightly increased for the age groups with the lowest homeownership rates (34 years old or younger and 75 years old and older) and decreased for householders in the groups that fell between the ages of 35 ad 74, with the largest decrease in the 45 to 54 age group (a 10 percentage point decrease).
VIEW TOPIC: HOUSING / HOMEOWNERSHIP RATE
DECEMBER 1, 2017
The educational attainment gap between adults living above and below the poverty level continued to widen in 2016 in North Dakota.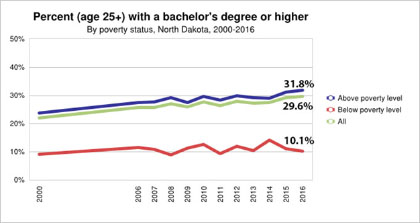
Since 2000, North Dakota’s percentage of adults (age 25 and older) holding a bachelor’s degree or higher has been slightly behind the national average. In 2016, North Dakota ranked 27th among the 50 states, with 29.6 percent of adults (age 25 and older) holding at least a bachelor’s degree.
However, while almost one-third of adults (31.8%) who live above the poverty level held a bachelor’s degree or higher, only one in 10 adults (10.1%) below the poverty level attained this education level. There has always been a gap in educational attainment by poverty status, but the gap widened further in 2016.
VIEW TOPIC:WORKFORCE / EDUCATIONAL ATTAINMENT
NOVEMBER 15, 2017
In North Dakota, obesity increased in nearly all age groups since 2011.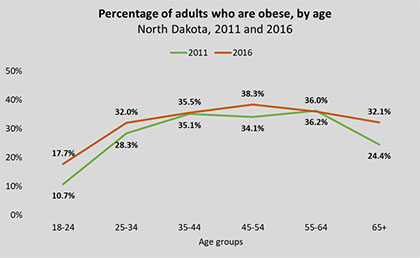
In 2016, obesity was most prevalent in middle age. Adults age 45-54 had the highest obesity rate at 38.3 percent, followed by the 55-64 age group at 36.0 percent, and the 35-44 age group at 35.5 percent. The group with the lowest obesity rate was the 18-24 age group at 17.7 percent.
When comparing obesity rates from 2011 to 2016, the pattern of obesity by age remains the same with obesity increasing as people get older and decreasing after they reach middle age. Obesity rates for most adult age groups increased with the largest increase (about 7 percentage points) being in the youngest adult (age 18 to 24) and older adult (age 65 and older) age groups. Middle age adults also saw a 4 percentage point increase in obesity rates.
NOVEMBER 1, 2017
Racial diversity in North Dakota has not grown consistently among age groups.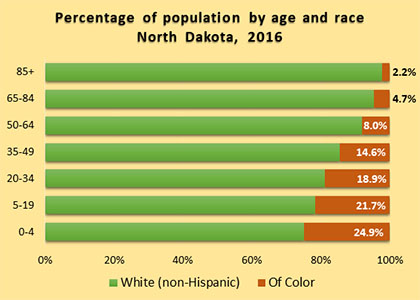
Over the last year (2015 to 2016), North Dakota’s population of color (i.e., Native American, Black, Asian, Hispanic, two or more races) increased by 4.6 percent. From 2010 to 2016, North Dakota’s population of color dramatically increased by 53.5 percent, which is the highest rate of any state (for comparison, U.S. population of color increased by 12.3 percent for the same time period.
However, racial diversity has not grown consistently among age groups; the younger the age group, the more diverse the population. One in four young children (0 to 4 years old) is a person of color (24.9%) as compared to 1 in 20 in the 65-84 age group (4.7%), and 1 in 50 for people age 85 and older (2.2%).
The growth in diversity of younger age groups is explained in part by the increase in the number of births belonging to a group of color and decrease in the number of White, non-Hispanic births. From 2015 to 2016, the number of births for White, non-Hispanic population decreased 4.0 percent, while the number of births for population of color increased 18.1 percent.
VIEW TOPIC: DEMOGRAPHICS/ AGE
October 16, 2017
With more diversified economies, Fargo and Grand Forks metropolitan areas continued to grow in 2016 despite the drop in state GDP.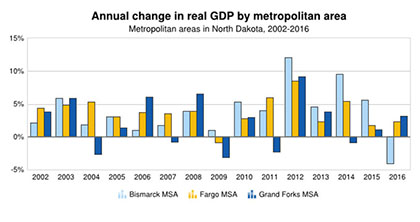
North Dakota’s economy has grown substantially over the past 10 years. After remarkable growth from 2006 to 2014, North Dakota’s economy contracted 3.1 percent in 2015 and 6.5 percent in 2016, due to dropping commodity prices both in the oil and gas industry and agriculture.
Despite the decline in statewide Gross Domestic Product (GDP), with more diversified economies, North Dakota’s metro areas continued to grow in 2015, and Fargo and Grand Forks continued the growth in 2016. From 2015 to 2016, the Grand Forks metro area real GDP grew by 3.1 percent and Fargo metro area’s GDP increased by 2.3 percent while Bismarck’s GDP decreased by 4.1 percent.
VIEW TOPIC: ECONOMY/ ECONOMIC OUTPUT (GDP)
October 2, 2017
North Dakota ranks first in the nation for the share of cost-burdened households, but 1 in 10 households pay more than half of their income for housing.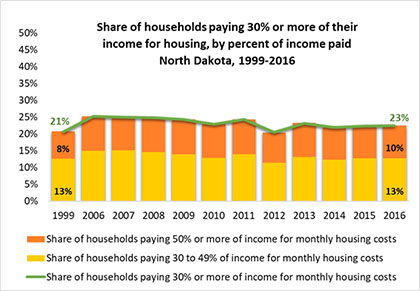
A household is considered housing cost-burdened when 30 percent or more of its monthly gross income is dedicated to housing costs, including the cost of utilities. North Dakota ranked 1st in the country with the lowest percentage of households whose housing costs exceed the threshold of affordability, at 23 percent, in 2016. However, 10 percent of households pay more than half of their income on housing. The share of cost-burdened households increased by two percentage points from 1999 to 2016. Housing costs are more of a burden for renters than homeowners. Forty percent of renters in North Dakota use 30 percent or more of their income towards housing costs, while 13 percent of home owners are housing cost-burdened. Households paying a large share of their income on housing are likely to struggle to pay for other basic needs, forcing difficult trade-offs. They may have to make decisions that may result in poorer outcomes in other areas of well-being, such as dropping health care coverage or skipping meals to save on costs.
VIEW TOPIC: HOUSING / COST BURDENED HOUSEHOLDS
September 15, 2017
The number and percentage of babies born at low birth weight to teenage mothers increased in North Dakota in 2016 while the number of teen births continued to decrease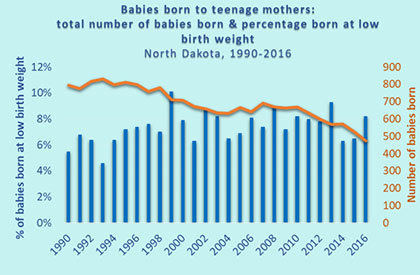
The percentage of babies born at low birth weight overall in North Dakota slightly increased from 6.1 percent in 2015 to 6.7 percent in 2016. Teenage mothers (under 20 years old) saw the largest increase in the percentage of babies born at low birth weight, from 6.5 percent in 2015 to 8.2 percent in 2016. A baby's birth weight indicates both the mother's health and nutritional status, and her baby's chances for growth, overall development, and long-term health. Babies born weighing under 5 pounds, 8 ounces are considered to have a low birth weight, which carries a range of health risks, including a weakened immune system, reduced muscle strength, decreased cognitive and social development, and a higher incidence of diabetes and heart disease in later life.
On a positive note, the number of teen births decreased from 527 in 2015 to 473 in 2016. The number of children born to mothers under 20 years old has been on a downward trend since 1990 in North Dakota and the U.S. Despite the decline, attention should continue to be given to the teen birth rate and especially to disparities with respect to location, race, and ethnicity.
VIEW TOPIC: EARLY CHILDHOOD/ LOW BIRTH WEIGHT
September 1, 2017
Households headed by single mothers with dependent children were most likely to be in poverty in North Dakota in 2015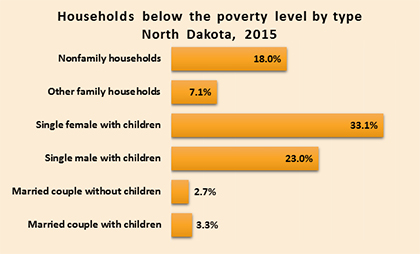
In 2015 there were 80,170 people living below the poverty level in North Dakota, 2,094 less than in 2014. Poverty refers to a state in which an individual lacks the monetary resources to afford basic human needs, such as clean water, nutrition, health care, education, clothing, and/or shelter. The lack of these resources makes it difficult to reach a minimum standard of living or wellbeing deemed acceptable by society.
At the household level, households headed by single mothers with dependent children were more likely to be in poverty (33.1%) than single male-headed households with children (23.0%) and much more likely to live in poverty than households headed by married couples with children (3.3%). The family’s economic situation has important implications especially when children are present. Children in an impoverished family experience disadvantages that influence not only the children’s life but also the communities in which they live (Child Poverty in North Dakota).
Note: The official poverty rate reported by the Census Bureau measures the percentage of the U.S. population with total income below the federal poverty threshold for their family size (e.g., $24,036 in 2015 for a family of four with two children). “Income” is calculated before taxes and includes only cash income, such as earnings, pension income, investment income, social security, unemployment benefits, and child support payments. Other federal and state benefits that help support low-income families such as Supplemental Nutrition Assistance Program (SNAP) benefits, tax benefits (e.g., Earned Income Tax Credit, Child Tax Credit) and housing subsidies are not counted as income under the official poverty measure.
VIEW TOPIC: ECONOMY/POVERTY
August 15, 2017
The aging of North Dakota's population may pose workforce challenges in the future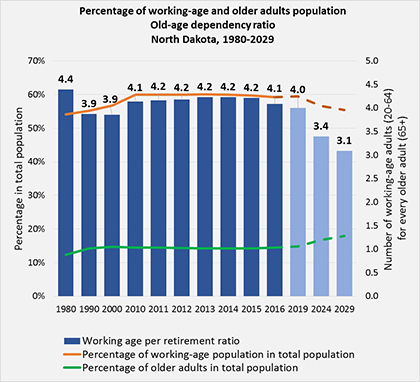
There were 109,999 older adults (65 years of age and older) in North Dakota in 2016, representing 15 percent of the total population, a percentage almost unchanged since 2010. With the aging of the baby boom generation (the large cohort of people born between 1946 and 1964), the share of older adults in the state’s population is expected to increase to 18 percent by 2029. Conversely, the share of the working-age population (age 20-64) is projected to decline from 59 percent of the total population in 2016 to 55 percent in 2029.
These demographic changes will potentially reduce the number of workers in relation to the population needing support. Even with the influx of more working-age people into the state, the ratio is projected to decrease from 4.1 working-age adults to every one older adult in 2016 to 3.1 working-age adults per every older adult by 2029. This information is helpful for individuals, organizations, and policy makers to plan ahead for services, programs, and policies to minimize the impact of the aging population on labor force participation in the state.
VIEW TOPIC DEMOGRAPHICS/AGE
July 31, 2017
North Dakota’s child population continues to grow but at a slower rate.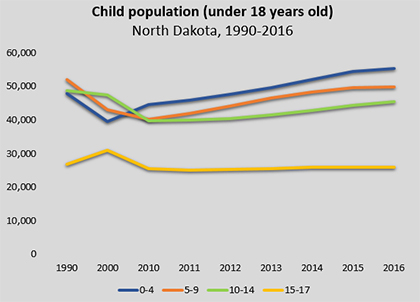
After decades of continuous loss from 1960 to the late 2000s, the number of children (under 18 years old) in North Dakota has grown consistently since 2008, by approximately 3 percent annually through 2015. However, similar to the overall population trend, the child population growth slowed in 2016. Reaching a population of 176,311 in 2016, children (under 18 years old) accounted for 23 percent of North Dakota’s total population.
From 2010 to 2016 the number of children (under 18 years old) in North Dakota increased by more than 26,000, or 18 percent, while the number of children in the U.S. decreased by one percent during the same time period. Specifically, young children in both the 0-4 and 5-9 age groups experienced the largest percent growth with a 24 percent increase, while the 15-17 age group saw little growth (2%) from 2010 to 2016.
VIEW TOPIC:CHILDREN & YOUTH/POPULATION TRENDS
July 17, 2017
Racial gaps in high school graduation rates shrunk in North Dakota in 2016
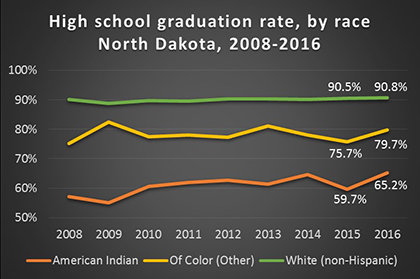
While overall rates showed a slight improvement over the last year, the percent of students graduating on time in North Dakota have remained fairly steady during the past 8 years, between 85 and 87 percent. However, racial gaps in the high school graduation rate continue to persist in North Dakota. In 2016, 65.2 percent of American Indians students and 79.7 percent students of color graduated on-time, compared to 90.8 percent of White (non-Hispanic) students.
Although gaps persist, the racial gaps are shrinking. Between 2015 and 2016, the high school graduation rate increased 5.5 percentage points for American Indian students and 4.0 percentage points for other students of color.
It is important to monitor progress in narrowing the gaps and improving results of education. In addition to achievement indicators, high school graduation can be useful in predicting young adults’ preparation for higher education and/or the workforce.
Note: The four-year graduation rate is calculated by dividing the number of students who graduate in four years or less with a regular high school diploma by the number of students who form the adjusted cohort for that graduating class. The adjusted cohort is a total count of first-time 9th graders in the fall of their freshman year, plus students who transfer into the cohort, minus students who transfer out of the cohort, emigrate, or die during the four school years of high school.
VIEW TOPIC:EDUCATION/HIGH SCHOOL GRADUATION
July 1, 2017
While still the fourth youngest state in the nation, North Dakota grew older in 2016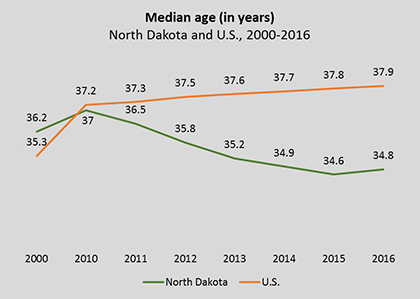
The population in most states has increasingly become older. The increase in the median age (the age where half of the population is younger and the other half older) is a result of the aging of the baby-boom generation, those born between 1946 and 1964. The median age in the U.S. steadily increased from 35.3 in 2000 to 37.2 in 2010 and to 37.9 in 2016.
However, North Dakota was one of the few states who reversed this trend. For five years, North Dakota’s population had been growing younger as the median age continually decreased from 37.0 in 2010 to 34.6 in 2015. While the median age increased to 34.8 in 2016, North Dakota was still the fourth youngest state out of the 50 states in the nation with only Texas, Alaska, and Utah having a younger median age.
VIEW TOPIC:DEMOGRAPHICS/AGE
June 20, 2017
Change in trends in North Dakota voter turnout by race.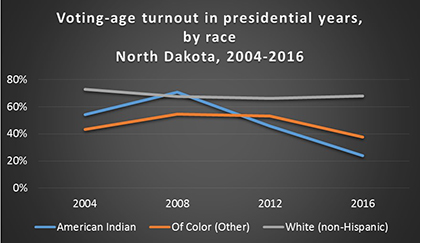
Nearly 350,000 North Dakota residents (of voting-age) voted in the 2016 presidential election. In 2016, the voting-age turnout* was 61 percent in North Dakota, a rate similar to 2012, but lower than the 65 percent rate in 2008. In the 2016 election, the voting-age turnout was higher in North Dakota (61%) than the U.S. (55%).
Similar to the U.S., the trends of voter turnout in a presidential election by race reversed in 2016 as the voter turnout for the White (non-Hispanic) population slightly increased, while the turnout for the non-White population decreased. Specifically, the voter turnout for the American Indian population dropped from 71 percent in 2008 to 46 percent in 2012 and to 24 percent in 2016. The other population of color voter turnout also saw a decline of 15 percentage points in 2016 compared to the previous presidential election.
* Voting-age turnout is calculated by dividing the total number of voters (ballots cast) by the estimated voting-age population of age 18 and older
VIEW TOPIC: CIVIC ENGAGEMENT/VOTER TURNOUT
June 2, 2017
Employment in almost all industry sectors in North Dakota gained jobs in the past 15 years.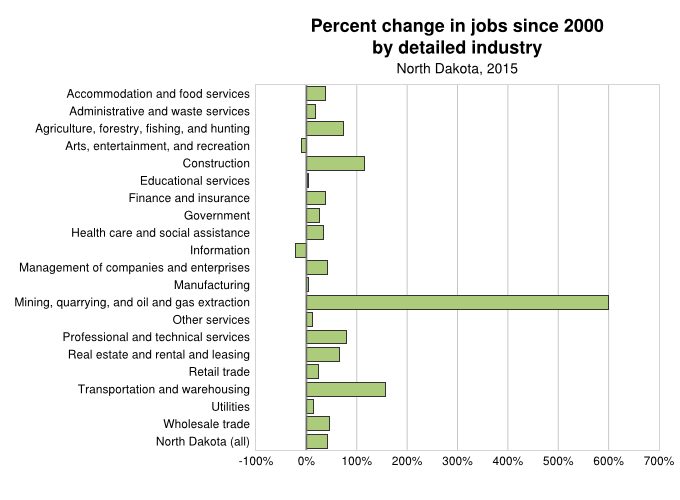
A shortage of jobs increases unemployment, reduces tax revenues, and curtails economic growth. In North Dakota, employment in almost all industry sectors, relating to nonfarm positions, gained jobs in the past 15 years. From 2000 to 2015, jobs in the Mining, quarrying, and oil and gas extraction industry increased substantially by nearly 600 percent. The industry increased its share of total jobs from 1.1 percent in 2000 to 5.3 percent in 2015. The next largest increase in jobs was in the Transportation and warehousing industry (157% increase) followed by Construction industry (116% increase). Although the number of jobs in the Mining, quarrying, and oil and gas extraction sector grew dramatically in the past, recent data indicate that the sector declined 22.2 percent from 2014 to 2015.
When looking at the share of jobs by industry (relating to nonfarm positions), in 2015, the Government sector represented the largest share of jobs in North Dakota (16.0%). Jobs in Education/Health (i.e., Educational services and Health care and social assistance) represented 13.5 percent and jobs in the Retail sector, 11.6 percent. Jobs in Natural resources/mining (i.e., Agriculture, forestry, fishing and hunting and Mining, quarrying, and oil and gas extraction) represented 6.3 percent of all jobs.
May 15, 2017
Fargo and West Fargo lead the cities in foreign born residents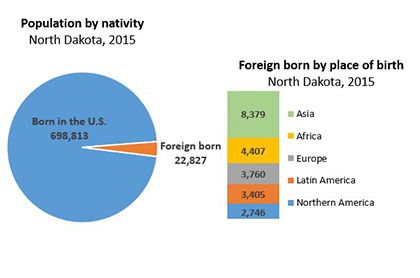 City of Fargo had the highest percentage of foreign born residents at 7.5 percent and 4.8 percent of the residents of West Fargo were foreign born.
In 2015 the Census Bureau estimated that there were nearly 23,000 residents in North Dakota who were foreign born, accounting for 3.2 percent. This includes U.S. naturalized citizens and those individuals who are not U.S. citizens, but does not include those born in Puerto Rico or the U.S. Island areas or those born to American parents abroad. Out of the foreign born, over 14,000 or 61.5 percent were not U.S. citizens (2015 American Community Survey 5-Year Estimates). Out of the foreign born population, 36.7 percent were born in Asia, 19.3 percent in Africa, 16.5 percent in Europe, 14.9 percent in Latin America, and 12.0 percent in Northern America.
View topic: GEOGRAPHIC PROFILES/CITY PROFILES
May 1, 2017
Ground-level ozone was the peak air pollutant in most days in 2016 in North Dakota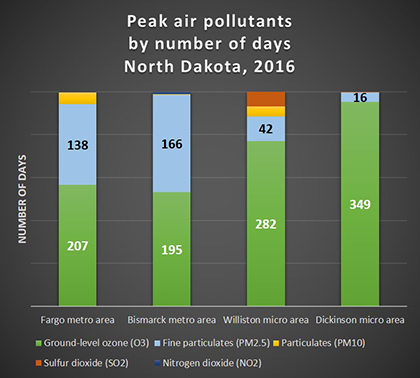 The Air Quality Index (AQI), measures five of the main pollutants regulated by the Clean Air Act for each day of the year. Days are rated as "Good," "Moderate," "Unhealthy for Sensitive Groups," or "Unhealthy" based upon the amount of pollutants in the air.
In 2016, the AQI was “Good” in 90 percent of days or more, in eight of the ten North Dakota counties that have sites that monitor air pollutants.
Ground-level ozone was the peak air pollutant (i.e., the pollutant responsible for the highest daily index value) for most days in 2016 for all metropolitan and micropolitan areas with air quality monitors. For Dickinson micropolitan area (Stark county), ground-level ozone was the main pollutant in 349/365 days in 2016. Fine particulates was the main pollutant in Bismarck metropolitan area (Burleigh, Morton, Oliver and Sioux counties) in 166/365 days in 2016. Ground-level ozone, commonly known as smog, and particle pollution pose the greatest known health risks to humans.
View topic: ENVIRONMENT / AIR QUALITY
April 13, 2017
Generation X leads volunteering among generations in North Dakota in 2015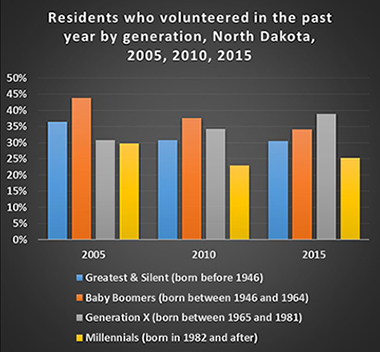 Volunteering is a form of civic engagement that brings significant benefits to individuals and communities. Volunteers are important community assets, helping to enrich the lives of those they serve and often providing care and services that neither government nor the private sector can afford to provide on their own. The percent of North Dakota’s residents (age 16 and older) who volunteer has consistently been higher than the U.S. average; 32 percent in North Dakota as compared to 25 percent in the U.S. in 2015.
In the past decade, the volunteering patterns changed for different generations of volunteers. The percentage of residents who volunteered belonging to the Greatest and Silent Generations (those born before 1946) and to the Baby Boomers (born between 1946 and 1964) decreased from 2005 to 2015. In contrast, the percentage of volunteers belonging to the Generation X (born between 1965 and 1981) increased from 31 percent in 2005 to 39 percent in 2015, taking the lead of all generations in 2015. Millennials (born 1982 or after) also saw an increase in volunteering between 2010 and 2015.
View topic: CIVIC ENGAGEMENT / VOLUNTEERISM
April 1, 2017
Growth rate has slowed for the majority of North Dakota’s counties.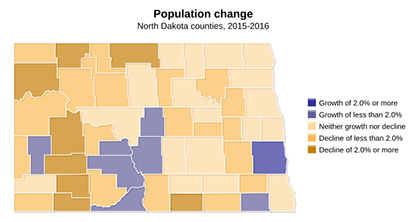 North Dakota reached an all-time high of 757,952 residents in 2016, but after years of unprecedented growth in response to an expanding economy, North Dakota’s population remained relatively unchanged from 2015 to 2016. Similar to the state overall, counties have seen a slowing or more of a decline in population. Formerly booming with growth, the majority of core oil producing counties have reversed their population change and the rate declined when comparing 2015 and 2016. The number of counties that had a decline in population from 2015 to 2016 doubled from the previous year (27 counties compared to 13 counties, respectively). Eight counties grew from 2015 to 2016; five of these counties were metropolitan counties.
View topic: DEMOGRAPHICS / POPULATION
March 15, 2017
Although North Dakota showed slight improvement, the state still ranks 7th lowest in the nation with regard to children enrolled in preschool.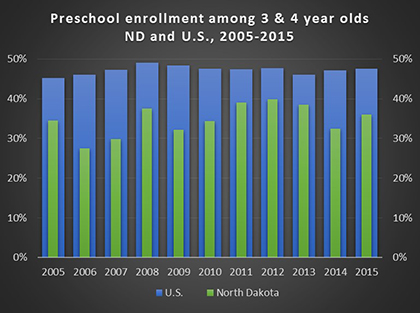 Early learning experiences are essential for a child's healthy intellectual, social, and emotional development. These experiences help create a foundation for children to be successful students and eventually productive adults. In 2015, nationally, 47.6 percent of children ages 3 and 4 were enrolled in preschool (i.e., organized child care programs offering educational experiences for children during the years preceding kindergarten – including Head Start). In North Dakota, 36 percent of children ages 3 and 4 were enrolled in preschool programs in 2015, placing North Dakota seventh lowest among the 50 states. However, the percent of North Dakota children enrolled in preschool slightly increased from the previous year when it was 32.5 percent, which gave the state the second lowest national place ranking.
View topic: EARLY CHILDHOOD / PRESCHOOL ENROLLMENT
March 1, 2017
While North Dakota is getting younger, some counties continue to age.
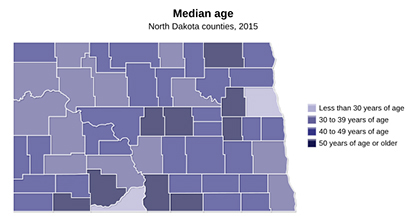 In 2015, North Dakota continued to get younger as the median age decreased from 34.9 years in 2014 to 34.6 in 2015. In 2015, North Dakota was the fourth youngest state in the nation and the only state with a decrease in median age when compared to the previous year.
Despite this state-wide trend, the median age in 38 counties was at least 40 years and in 9 counties the median age was at least 50 years. Increased opportunities for employment in the oil producing counties and metro areas attracted younger workers to the state and contributed to the decrease in the median age in those areas. In contrast, mostly rural counties continued the historic aging trend.
However, all counties are going to be influenced by the increase in the older adult population (age 65 and older) as the baby boomers (those born from 1946 through 1964) continue to age. As a result of this, the older adult population is projected to increase by 49.1 percent over the next 14 years, from 107,281 in 2015 to 159,969 in 2029 – a projected growth two to five times greater than that of the other age groups.
View topic: DEMOGRAPHICS / AGE
February 15, 2017
The higher the income, the lower the percentage of adults diagnosed with diabetes.
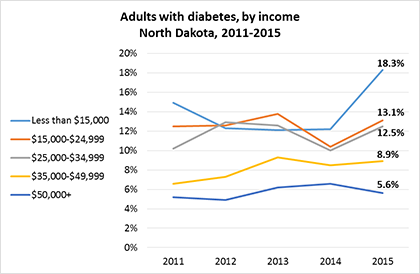 The diabetes rate for adults in North Dakota remained fairly constant since 2014 and increased slightly from 8.2 percent in 2011 to 8.7 percent in 2015. Nationally, North Dakota ranked 13th lowest among states for adults diagnosed with diabetes.
Diabetes rates increased slightly from 2014 to 2015 in North Dakota for women, low income adults, and adults with less than a high school diploma.
The diabetes rate for adults in North Dakota remained fairly constant since 2014 and increased slightly from 8.2 percent in 2011 to 8.7 percent in 2015. Nationally, North Dakota ranked 13th lowest among states for adults diagnosed with diabetes.
Diabetes rates increased slightly from 2014 to 2015 in North Dakota for women, low income adults, and adults with less than a high school diploma.
The higher the income, the lower the percentage of adults diagnosed with diabetes. The percentage of adults with incomes of $50,000 or more who have diabetes decreased slightly from 6.6 percent in 2014 to 5.6 percent in 2015, while the percentage of adults with incomes below $15,000 who have diabetes increased from 12.2 percent in 2014 to 18.3 percent in 2015.
February 1, 2017
Older adults in North Dakota have modest income levels as compared to the other age groups.
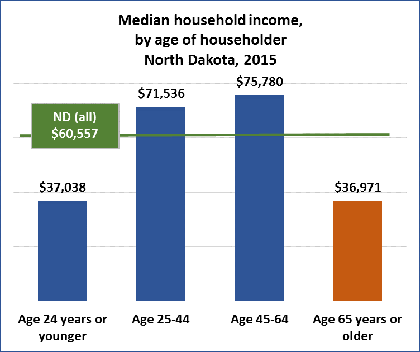 In the last five years, the median household income in North Dakota has been increasing and has been trending above the national median income. However, some population groups are more vulnerable than others. The median income of older households (householders age 65 and older), at $36,971 in North Dakota in 2015, was well below the overall median household income ($60,557) and less than half of the households headed by a person age 45 to 64 ($75,780).
Attention should be given to this age group as the older adult population (65 years and older) is increasing and will continue to increase, according to the latest population projections. With 97,477 older adults in 2010 and 107,281 in 2015, the older adult population is projected to increase to 159,969 by 2029. This growth would represent a 64 percent increase from 2010 and will constitute an important shift in the age distribution of North Dakota’s population.
In the last five years, the median household income in North Dakota has been increasing and has been trending above the national median income. However, some population groups are more vulnerable than others. The median income of older households (householders age 65 and older), at $36,971 in North Dakota in 2015, was well below the overall median household income ($60,557) and less than half of the households headed by a person age 45 to 64 ($75,780).
Attention should be given to this age group as the older adult population (65 years and older) is increasing and will continue to increase, according to the latest population projections. With 97,477 older adults in 2010 and 107,281 in 2015, the older adult population is projected to increase to 159,969 by 2029. This growth would represent a 64 percent increase from 2010 and will constitute an important shift in the age distribution of North Dakota’s population.
View topic: ECONOMY / MEDIAN INCOME
Center for Social Research
North Dakota State University
Compass created by:
Wilder Research
© 2025. All rights reserved.