2025 State Legislative District Profiles
North Dakota Compass provides demographic and socio-economic profiles for the North Dakota State Legislative Districts. The profiles highlight 16 measures focusing on population, household, social, and economic characteristics for each of the districts in North Dakota. Each profile compares district information with North Dakota and the United States.
2025 Profiles
Data provided by the Census Bureau for the 2025 profiles are based on the 2023-2032 North Dakota legislative district boundaries as initially approved after the 2020 Census. We updated the district boundaries to the 2025-2032 maps as approved by the court in 2024. However, the Census Bureau did not have the new boundaries and therefore data for districts 9, 14, and 15 as they are defined now, are not available.
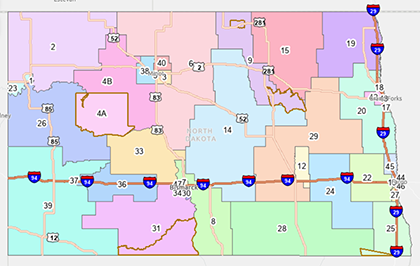
The interactive dashboard highlighting individual profiles, interactive maps for all districts, and a compare feature has been updated. The maps add value to the individual district profiles by having all the information on a map to easily visualize differences among districts. The legend is especially helpful to see how much variation there is among districts. The compare feature allows to compare two individual districts between them and with North Dakota and US.
Click here for the interactive dashboard!
View your district profile in PDF format below:
- North Dakota State Legislative District 1
- North Dakota State Legislative District 2
- North Dakota State Legislative District 3
- North Dakota State Legislative District 4A
- North Dakota State Legislative District 4B
- North Dakota State Legislative District 5
- North Dakota State Legislative District 6
- North Dakota State Legislative District 7
- North Dakota State Legislative District 8
- North Dakota State Legislative District 10
- North Dakota State Legislative District 11
- North Dakota State Legislative District 12
- North Dakota State Legislative District 13
- North Dakota State Legislative District 16
- North Dakota State Legislative District 17
- North Dakota State Legislative District 18
- North Dakota State Legislative District 19
- North Dakota State Legislative District 20
- North Dakota State Legislative District 21
- North Dakota State Legislative District 22
- North Dakota State Legislative District 23
- North Dakota State Legislative District 24
- North Dakota State Legislative District 25
- North Dakota State Legislative District 26
- North Dakota State Legislative District 27
- North Dakota State Legislative District 28
- North Dakota State Legislative District 29
- North Dakota State Legislative District 30
- North Dakota State Legislative District 31
- North Dakota State Legislative District 32
- North Dakota State Legislative District 33
- North Dakota State Legislative District 34
- North Dakota State Legislative District 35
- North Dakota State Legislative District 36
- North Dakota State Legislative District 37
- North Dakota State Legislative District 38
- North Dakota State Legislative District 39
- North Dakota State Legislative District 40
- North Dakota State Legislative District 41
- North Dakota State Legislative District 42
- North Dakota State Legislative District 43
- North Dakota State Legislative District 44
- North Dakota State Legislative District 45
- North Dakota State Legislative District 46
- North Dakota State Legislative District 47
Center for Social Research
North Dakota State University
Compass created by:
Wilder Research
© 2025. All rights reserved.