Data highlight
December 1, 2022
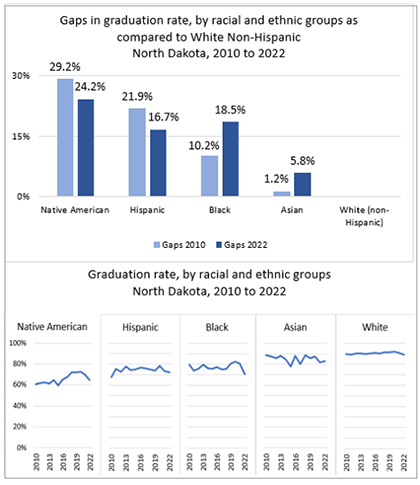
Post-pandemic on-time high school graduation rates dropped for all racial and ethnic groups in North Dakota, but some racial disparity gaps still show improvement from 2010.
Developments in science and technology have created jobs that did not exist a decade ago. A high school diploma opens doors for better employment and also for higher education. Studies show that students who graduate from high school have higher self-esteem, feel more confident in pursuing a career, and have opportunities for higher lifetime earnings. In addition to achievement indicators such as reading and math proficiency, high school graduation can be useful in predicting young adults’ preparation for higher education and/or the workforce.
Prior to the COVID-19 pandemic, the percentage of students graduating high school on-time overall in North Dakota had been gradually increasing, from 87% in 2010 to 89% in 2020. Pre-pandemic improvements in the on-time high school graduation rate were also evident across most racial and ethnic groups. The 2020 graduation rates improved 12 percentage points for Native American, 11 points for Hispanic, and 3 points for Black students as compared to 2010 graduation rates. Asian students were the only group that showed a slight decrease in graduation rate from 2010 to 2020.
After continued educational disruption by the pandemic, overall, on-time high school graduation rate dropped to 87% in 2021 and 84% in 2022 in North Dakota. The 2021 and 2022 numbers show a decrease in the on-time graduation rate for all racial groups, especially for Black students (12 percentage point drop from 2020 to 2022) and Native American students (8 percentage point decrease).
However, when compared to 2010, disparity gaps still show improvement for Native American and Hispanic students over the past 12 years when compared to White non-Hispanic students (gap decreased by 5 percentage points for each of them). While lower initially compared to other racial group disparity gaps, gaps for Black and Asian students increased in 2022 as compared to 2010.
Note:
On-time high school graduation rate reflects the percentage of students who graduated from high school within four years of entering the ninth grade, calculated by dividing the number of students who graduate in four or fewer years by the total number of first-time entering ninth graders (adjusted for transfers in and transfers out during the four years).
VIEW TOPIC: EDUCATION/HIGHSCHOOL GRADUATION
November 1, 2022
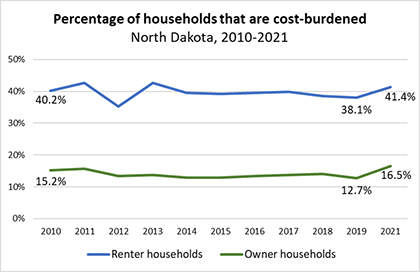
Housing costs in North Dakota are substantially more of a burden for renters than for homeowners, but both felt the strain of the pandemic.
Households paying a large share of their income on housing are likely to struggle to pay for other basic needs, forcing difficult trade-offs. When more than 30 percent of a household’s income goes towards rent or mortgage payments, people must make decisions that may result in poorer outcomes in other areas of well-being, such as dropping health care coverage or skipping meals to save on costs.
Compared to other states, the percentage of North Dakota households burdened with housing costs (i.e., spending at least 30% of household income toward housing costs) is relatively low (25% of households were cost-burdened in 2021, ranking ND as fifth lowest among states). However, North Dakota’s situation worsened as compared to 2019 when it ranked second among states with 22 percent of households being cost-burdened.
In North Dakota, housing costs continue to be substantially more of a burden for renters than homeowners. In 2021, 41 percent of renters in the state were cost-burdened compared to 17 percent of homeowners.
While the percentage of housing cost-burdened homeowners and renters decreased slightly over the past decade, it sharply increased in the past two years as the pandemic unfolded. In those past two years, 1,360 more renter households and 8,348 more homeowner households were housing cost-burdened in North Dakota. Housing insecurity increased especially for households that experienced a loss of employment income, which made it more likely for them to struggle to pay for usual household expenses such as rent or a mortgage. In addition, housing and rental prices increased straining households’ budgets even more.
VIEW TOPIC: HOUSING/COST-BURDENED HOUSEHOLDS
october 1, 2022
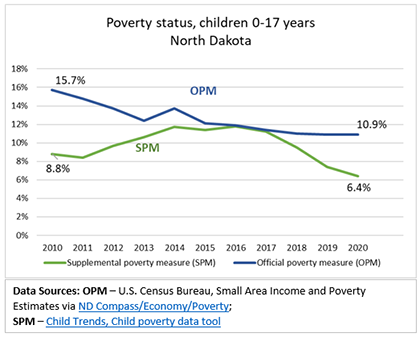
Two Measures to Assess Child Poverty in North Dakota – Both Show Improvement.
Two of the most accepted measures for determining poverty thresholds in the United States are the Official Poverty Measure (OPM) and the Supplemental Poverty Measure (SPM). The measures differ in their assumption of who shares resources within a household, what minimal requirements a family has to meet its needs, and what resources are available for a family to meet those needs (see note below). Both measures are important to understand child poverty. The OPM has been used since 1960s as a benchmark to measure the economic well-being of families and individuals in the US and to determine eligibility for federal programs. First developed in 2009, the SPM uses more up-to-date assumptions about current living needs and expenses and helps better understand economic well-being, especially the impact of government programs, like refundable tax credits and nutrition, housing, and energy assistance.
Children are considered in poverty when they live in families with incomes below 100% of the poverty threshold. While the SPM trends lower than the OPM for tracking child poverty in North Dakota, both measures show a decline in child poverty over the past decade in the state. According to the OPM, the child poverty rate decreased from 16 percent in 2010 to 11 percent in 2020. The SPM, which takes into consideration a larger pool of expenses as well as a broader set of resources, including in-kind benefits, shows the child poverty rate decreased from 9 percent in 2010 to 6 percent in 2020. Over the past three years, the OPM shows little change in child poverty, yet the SPM, which takes into consideration government programs including those instituted during the pandemic, shows continued improvement in North Dakota’s child poverty rate.
Note:
Difference between the OPM and SPM.
- In terms of who shares resources, the OPM assumes that only the traditional members of a family unit share resources (individuals residing together who are related by birth, marriage, or adoption). The SPM extends the traditional family definition to include any co-resident unrelated children, foster children, and unmarried partners and their relatives.
- In terms of needs, the OPM calculates the poverty threshold at three times the cost of a minimum food diet in 1963 and is adjusted every year for inflation. As housing and other costs have risen and spending on food accounts for a much smaller proportion of family budgets, the SPM extends beyond food costs and considers what people spend on health care, child care, clothing, shelter, utilities, and costs of commuting to work. While both measures adjust costs for family type and size, only the SPM accounts for geographic differences in cost of living.
- In terms of resources, the OPM defines a family’s income as their pre-tax cash earn¬ings (e.g., wages, salaries, Social Security benefits, interest, dividends, pensions). The SPM con¬sid¬ers, in addition to cash income, in-kind ben¬e¬fits, such as food and hous¬ing assis¬tance, as well as safe¬ty net ben¬e¬fits including the Earned Income Tax Cred¬it, housing subsidies, utility assistance, SNAP, and the School Lunch Program. SPM also sub¬tracts nec¬es¬sary expen¬di¬tures, such as child care, medical, and tax expenses.
VIEW TOPIC: ECONOMY/POVERTY
READ MORE:
U.S. Census Bureau. How the Census Bureau Measures Poverty Infographic
Child Trends. Lessons from a Historic Decline in Child Poverty
September 1, 2022
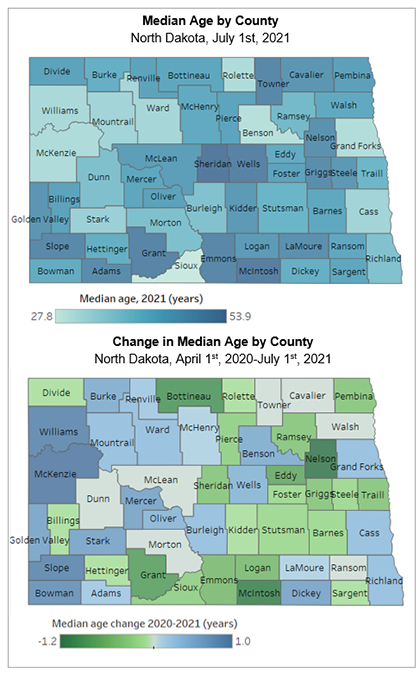
Growing older or getting younger: change in median age in North Dakota counties.
The population in most U.S. states has increasingly become older. The increase in the median age (the age where half of the population is younger and the other half older) is largely a result of the aging baby boom generation (those born between 1946 and 1964) and increased life expectancy. The median age in the U.S. steadily increased from 35.3 in 2000, to 37.2 in 2010, to 38.8 in 2021. However, North Dakota was one of the few states that for a period of time reversed this trend. For five years, North Dakota’s population got younger as the median age continually decreased from 37.0 in 2010 to 34.8 in 2015. However, in 2016, the median age started to slowly increase reaching 35.7 in 2021, making North Dakota the forth youngest state in the U.S.
While North Dakota still looks fairly young overall, in 2021 the median age at the county level ranges from 27.8 to 53.9 years, with 39 of the 53 counties having a median age older than the nation (38.8 years) and seven of those counties having a median age older than 50 years.
When comparing median age by county (July 1st 2021 to April 1st 2020) out of the 53 North Dakota counties, 24 decreased their median age, seven stayed the same and 22 increased their median age. The largest decrease in median age was observed in Nelson County (-1.2 years), McIntosh County (-1.1 years), and Bottineau County (-0.9 years). The largest increase in median age was observed in Williams and Slope Counties (+0.9 years each) and McKenzie County (+1.0 year).
Out of the seven oldest counties in North Dakota with a median age over 50 years (Sheridan, McIntosh, Wells, Grant, Emmons, Towner, and Slope), four became younger from 2020 to 2021 (McIntosh, Grant, Emmons, and Sheridan), Towner stayed the same, while Wells and especially Slope continued to increase the counties’ median age.
VIEW TOPIC: DEMOGRAPHICS/AGE
August 1, 2022
Half of North Dakota industry sectors starting to recover after immediate effects of pandemic.
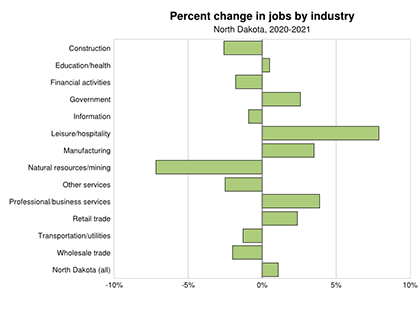
Serving as the primary source of income for U.S. households, jobs are essential to the economy. From 2019 to 2020 the number of jobs in North Dakota decreased dramatically (loss of 26,838 jobs or a 6.3 percent decrease in jobs, statewide). This was the largest percent decrease in jobs the state had seen in the last two decades. From 2020 to 2021, North Dakota jobs overall started to slowly recover and increased by 1.1 percent.
Looking specifically at industry sectors in North Dakota, all industries in 2020 saw a decrease in the number and percent change in jobs from the previous year. Percent change in jobs in specific industries were impacted at varying levels with the change ranging from -2.1 percent in Education and Health related jobs to -23.2 percent in Natural Resources and Mining related jobs. The industries with the next largest decline in 2020 in percent change in jobs was Leisure and Hospitality jobs (-15.3%), Construction jobs (-9.2%), and Transportation and Utilities jobs (-8.0%) in North Dakota.
From 2020 to 2021, some industry sectors in North Dakota started to recover or fair better than the previous year in terms of percent change in jobs, but again at varying degrees. Six of the 13 industries started to see a positive percent change in jobs. Leisure and Hospitality jobs saw the largest positive percent change in jobs at 7.9 percent growth, followed by Professional and Business Services (3.9%), and Manufacturing (3.5%). The remaining seven industries continued to have a negative percent change in jobs compared to previous year, although each experienced a smaller negative impact. The largest negative percent change in jobs was in the Natural Resources and Mining industry at -7.2 percent, followed by Construction (-2.6%), and Other Services (-2.5%).
VIEW TOPIC: ECONOMY/JOBS
July 1, 2022
In the past year, North Dakota cities experienced growth in some metropolitan areas and loss in the western part of the state.
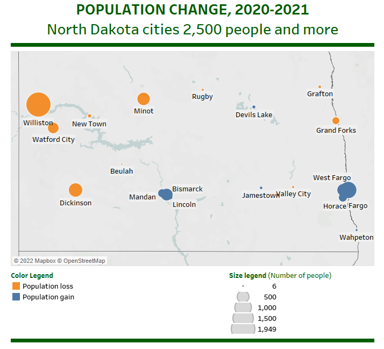
Cities in areas around Fargo and Bismark in North Dakota experienced the largest population growth from July 1, 2020 to July 1, 2021, according to new population estimates for cities and towns, recently released by the U.S. Census Bureau.
Among North Dakota cities with a population of 2,500 people or more, the cities of Fargo, West Fargo and Horace collectively gained 1,600 people in the past year (from July 2020 to July 2021) and Bismarck, Mandan and Lincoln jointly increased population by 732. The fastest-growing city in North Dakota by percent change was Horace with a 6.7 percent increase in population. Conversely, continued outmigration from western counties due to a downturn in the oil industry, led to population loss in the western part of the state. Williston lost 1,949 people, and Dickinson, Minot and Watford City also lost population in the past year (604 people, 517 people and 376 people, respectively).
Notes
1. Please note that this data highlight compares population increase from July 1, 2020 to July 1, 2021. Data in the charts on ND Compass compare population increase from April 1, 2020 (Decennial Census data) to July 1st 2021 (Population estimates).
2. Click here or on the picture for an interactive view.
VIEW TOPIC: DEMOGRAPHICS/POPULATION
June 1, 2022
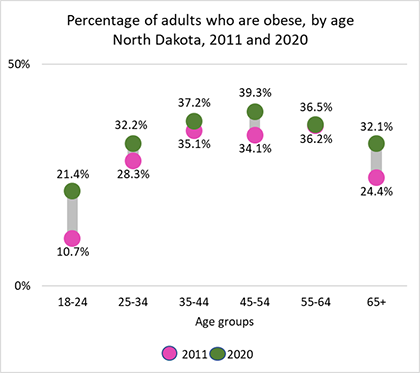
Compared to 2011, obesity rates increased for the youngest and oldest North Dakota adults. .
Obesity increases the likelihood of diabetes, cardiovascular disease, certain forms of cancer, hypertension, and other chronic diseases. Obesity poses a major threat in all countries of the world, the United States included.
Since 2011, the North Dakota adult obesity rate has trended above the national average. In 2011, 27.8 percent of North Dakota’s adults (age 18 and older) were obese, ranking North Dakota 25th among the 50 states (rankings from 1st - lowest rate to 50th - highest). Seven years later, in 2018, the adult obesity rate rose to 35.1 percent, ranking North Dakota 36th among the 50 states. In 2020, North Dakota ranked 29th among the 50 states with a rate of 33.1 percent, which is about 9 percentage points higher than 1st ranked Colorado.
Looking specifically at adult age group categories, in 2020 obesity was most prevalent in middle aged adults. Adults age 45-54 had the highest obesity rate at 39.3 percent, followed by the 35-44 age group at 37.2 percent and the 55-64 age group at 36.5 percent. The group with the lowest obesity rate was the 18-24 age group at 21.4 percent. However, the obesity rate for this age group doubled since 2011. When comparing obesity rates from 2011 to 2020, obesity rates increased for most adult age groups, most notably for the 18-24 and 65 and older age groups.
May 1, 2022
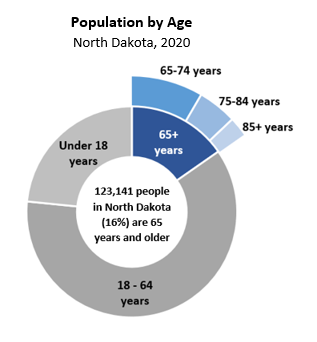
A look at Older North Dakotans .
The older adult population has and will likely continue to grow throughout North Dakota. The increase in the number of older adults will affect the state’s workforce, health and human services agencies, and beyond. From a decision-making perspective it is important to consider the actual change in numbers, the proportional change, as well as other breakdowns such as age subgroups and geography.
Although as a percent of the total population this age group has not seen big changes, due to the influx of younger population in the state, the number of older adults is increasing and will likely continue to increase with the aging of the baby boom generation (those born between 1946 and 1964). For example, the older adult population in North Dakota was 80,445 in 1980; 97,477 in 2010; and 123,141 in 2020.*
The older adult population (age 65 and older) represent 16 percent of the state’s population. According to the U.S. Census ACS 5-year estimates, more than half of them (55%) are people 65-74 years old, 30 percent are 75-84 years old and 15 percent are 85 and older. From 1980 to 2000, there was a large increase in the number of the oldest-old population (85 years and older). This population saw an 81 percent increase in total numbers from 8,140 in 1980 to 14,726 in 2000. In 2020, this age group accounted for 18,633 people in North Dakota. When looking at the change in population from 2000 to 2020, the 85 years and older population increased by 27 percent, which is a much smaller percentage increase than the previous time span of 1980-2000*.
By geography, in North Dakota, Sheridan County has the highest percentage of older adults, with one-third of the population (34%) being age 65 or older. There are 15 counties in North Dakota where more than one-fourth of population is age 65 or older. Sioux County has the lowest percent of older adults, at 9 percent.
Taking into consideration regional differences and the trends affecting the older population will help policy makers, health and human services, and community leaders more effectively plan for the needs, challenges and opportunities impacting older residents in North Dakota.
*Data according to the Census Bureau Population Estimates Program, 2020 Vintage.
April 1, 2022
Population change from 2020 to 2021 in North Dakota was not consistent across the state..
The U.S. Census Bureau’s population estimates as of July 1st, 2021, show a decline of 4,014 people in North Dakota when compared to the July 1st, 2020 population estimate. Recently released population estimates at lower levels of geography provide a more detailed look into the population change. Out of the state’s 53 counties, 34 lost population from 2020 to 2021. The losses range from 2,665 people in Williams County to 2 people in Logan county. The remaining 19 counties gained population. The highest gain was in Cass County (1,694 people).
Together, North Dakota’s urban counties lost 2,084 people, a 0.4 percent decrease from 2020. Rural counties lost 1,930 people collectively, a 1.0 percent decrease.
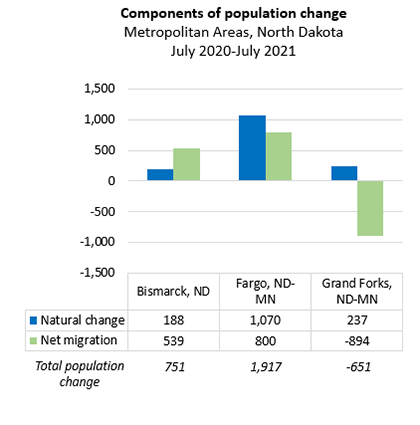
The Bismarck and Fargo metropolitan areas experienced a population increase from 2020 to 2021 (751 and 1,917, respectively). The Grand Forks metropolitan area lost 651 people from 2020 to 2021; a loss due to outmigration. Even though births outnumbered deaths by 237, there were 894 more people who moved out of the Grand Forks metro area than moved in during this timeframe.
Notes:
Natural change = births minus deaths.
Net migration = number of people who enter the area through domestic or international migration minus the people who leave the area.
Fargo Metropolitan Area comprises Cass County, North Dakota and Clay County, Minnesota.
Bismarck Metropolitan Area comprises Burleigh, Morton, and Oliver counties in North Dakota.
Grand Forks Metropolitan Area comprises Grand Forks County, North Dakota and Polk County, Minnesota.
Data Source: U.S. Census Bureau, Population and Housing Units Estimates.
March 1, 2022
Households with children mostly spent the 2021 Child Tax Credit payments on food.
Payments from the expanded Child Tax Credit (CTC), issued monthly from July to December 2021, helped parents to cover basic living expenses or pay down debt.
The U.S. Census Bureau’s Household Pulse Survey collected responses regarding spending of the CTC, from July 2021 to January 2022. The survey asked adults in households if they had received a CTC payment in the past four weeks, and if yes, they were asked to identify what they spent their CTC payment on. Respondents were able to select more than one option.
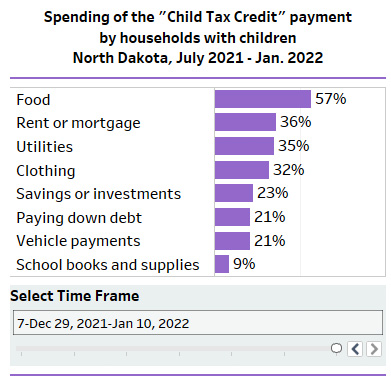
In North Dakota, the most common reported uses of the CTC payments were for basic needs (food, utilities, rent) and savings or paying down debt. Among choices, food consistently ranked first in terms of spending, ranging from 44 percent to 57 percent of households reported.
After food, reported spending over time shows that North Dakota households were more likely to spend CTC payments on school expenses and clothes around the start of school in August and early September, and on utilities and rent from September to the end of 2021. In January 2022, 57 percent of households with children that received CTC payments spent them on food, 36 percent on rent or mortgage, and 35 percent to pay for utilities.
Notes:
Click here or on the picture for an interactive view. Select the timeframe to view. You can choose among seven time periods between July 2021 to January 2022. Hover over the chart bars for more detail.
Definitions: The percentage of households with children who spent the “Child Tax Credit” on different types of household and personal expenses and savings. Only those respondents who reported that someone in their household had received a “Child Tax Credit” payment in the past four weeks and provided a valid response are included.
Data Source: U.S. Census Bureau Household Pulse Survey. Data retrieved from KIDS COUNT Data Center
February 1, 2022
A look into the slight decline in North Dakota’s population.
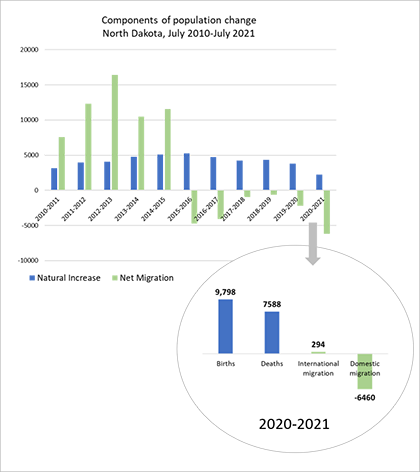
U.S. Census Bureau’s population estimates as of July 1st, 2021, show a decline of 4,014 people in North Dakota’s population as compared to the July 1st, 2020 population estimate. This population drop reverses a decade of population growth – tremendous growth from 2010 to 2015 and steady growth from 2016 to 2020.
A look at the components of change reveal some insight into the population loss. North Dakota had 9,798 births and 7,588 deaths from July 1st, 2020 to July 1st, 2021. The larger number of births compared to the number of deaths kept the natural change positive in 2021, however smaller than in any year of the previous decade. This is due to a slightly lower number of births and an increase in the number of deaths as compared to previous years (e.g., 10,536 births and 6,250 deaths in 2019, a COVID-19 pre-pandemic year).
Another component of population change is the net migration calculated as the number of people who enter the state (in-migration) minus the number of people who leave the state (out-migration). From July 1st, 2020 to July 1st, 2021, North Dakota experienced a larger number of people leaving than entering the state, a negative net migration of 6,166 residents, which is the largest loss of population due to migration since 2010. The negative net migration is due to a large number of domestic out-migration (-6,460 people) and a very small international in-migration (294 people). These changes can be attributed to the COVID-19 pandemic that impacted all components of population change – births, deaths, and migration in addition to changing economic circumstances and immigration policies.
Source: U.S. Census Bureau, Population and Housing Unit Estimates Vintage 2020 Estimates (Evaluation Estimates); Vintage 2021 Estimates
january 1, 2022
COVID-19 vaccine hesitancy among North Dakota adults in households with children 12 to 17 years old.
According to North Dakota Department of Health, as of December 2021, about two in five North Dakota children, age 12 to 18, have received at least one dose of COVID-19 vaccine. The U.S. Census Bureau Household Pulse Survey collected information about children vaccination starting with phase 3.2 (July to October 2021). The new children vaccination questions provide some information about parents or guardians hesitant to have their children get the vaccine and the reasons behind that.
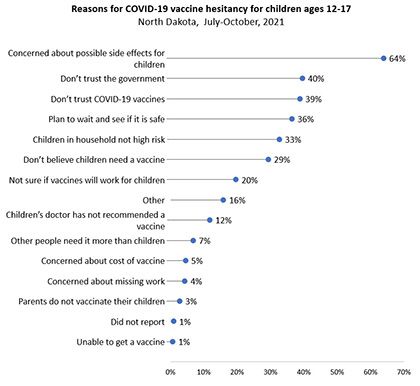
According to data collected by the Household Pulse Survey from July to October 2021, among North Dakota adults in households with non-vaccinated children age 12 to 17, eight percent definitely plan to vaccinate their children, 10 percent would probably get their children vaccinated, 15 percent are unsure, 14 percent would probably not vaccinate, and 37 percent definitely do not plan to vaccinate their children.
By excluding those who declared they would definitely get a vaccine, all others are considered hesitant (i.e., those who answered probably get a vaccine, unsure about getting a vaccine, probably not get a vaccine, definitely not get a vaccine). Overall, from July to October 2021, the main reasons mentioned by North Dakota parents/guardians who are hesitant to vaccinate their children against COVID-19 are concern about possible side effects for children (64%), lack of trust in the government (40%), and lack of trust in COVID-19 vaccines (39%).
For more detailed information about this topic, see the U.S. Census Household Pulse Survey and the COVID-19 Vaccination Tracker. Find more COVID-19 data resources on North Dakota Compass.
VIEW TOPIC:COVID-19 Data Resources
Center for Social Research
North Dakota State University
Compass created by:
Wilder Research
© 2025. All rights reserved.